
Page 107 - MSAM-3-2
P. 107
Materials Science in Additive Manufacturing NiTi lattice: Performance optimization
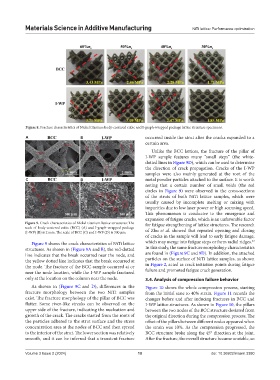
Figure 8. Fracture characteristics of Nickel titanium body-centered cubic and I-graph-wrapped package lattice structure specimens.
A B occurred inside the strut after the cracks expanded to a
certain area.
Unlike the BCC lattices, the fracture of the pillar of
I-WP sample features many “small steps” (the white-
dotted lines in Figure 9D), which can be used to determine
the direction of crack propagation. Cracks of the I-WP
samples were also mainly generated at the root of the
C D metal powder particles attached to the surface. It is worth
noting that a certain number of small voids (the red
circles in Figure 9) were observed in the cross-sections
of the struts of both NiTi lattice samples, which were
usually caused by incomplete melting or mixing with
impurities due to low laser power or high scanning speed.
This phenomenon is conducive to the emergence and
expansion of fatigue cracks, which is an unfavorable factor
Figure 9. Crack characteristics of Nickel titanium lattice structures: The for fatigue strengthening of lattice structures. The research
scale of body-centered cubic (BCC) (A) and I-graph-wrapped package
(I-WP) (B) is 2 mm. The scale of BCC (C) and I-WP (D) is 300 μm. of Zhu et al. showed that repeated opening and closing
of cracks in the sample will lead to early fatigue damage,
53
Figure 9 shows the crack characteristics of NiTi lattice which may merge into fatigue steps or form radial ridges.
structures. As shown in (Figure 9A and B), the red-dotted In this study, the same fracture morphology characteristics
line indicates that the break occurred near the node, and are found in (Figure 9C and 9D). In addition, the attached
the yellow dotted line indicates that the break occurred at particles on the surface of NiTi lattice samples, as shown
the node. The fracture of the BCC sample occurred at or in Figure 2, acted as crack initiation points during fatigue
near the node location, while the I-WP sample fractured failure and promoted fatigue crack generation.
only at the location on the column near the node. 3.4. Analysis of compression failure behavior
As shown in (Figure 9C and D), differences in the Figure 10 shows the whole compression process, starting
fracture morphology between the two NiTi samples from the initial state to 40% strain. Figure 11 records the
exist. The fracture morphology of the pillar of BCC was changes before and after inducing fractures in BCC and
flatter. Some river-like streaks can be observed on the I-WP lattice structures. As shown in Figure 10, the pillars
upper side of the fracture, indicating the nucleation and between the two nodes of the BCC structure deviated from
growth of the crack. The cracks started from the roots of the original direction during the compression process. The
the particles adhered to the strut surface and the stress offset of the pillars between different nodes appeared when
concentration area at the nodes of BCC and then spread the strain was 10%. As the compression progressed, the
to the interior of the strut. The lower section was relatively BCC structure broke along the 45° direction at the joint.
smooth, and it can be inferred that a transient fracture After the fracture, the overall structure became unstable, so
Volume 3 Issue 2 (2024) 10 doi: 10.36922/msam.3380