
Page 102 - MSAM-3-2
P. 102
Materials Science in Additive Manufacturing NiTi lattice: Performance optimization
fraction, all of these happen because of the excessive properties, and different unit cell types of lattice structures
adhesion of metal powder particles on the surface of the also exhibit similar mechanical behavior.
sample. The occurrence of this phenomenon will become The main mechanical properties of NiTi BCC and
more common if the laser power is too large or the laser I-WP lattice structures calculated from Figure 3 are listed
scanning speed is too slow. in Table 2. The Young’s modulus and yield strength of the
The LPBF process has similar forming accuracy in the I-WP lattice structure were higher than those of the BCC
preparation of two lattice structures. Figure 2E and F show lattice structure. According to ISO13314, the gradient
that there is not much of a difference in actual volume of the straight line in (Figure 3A) can be determined
fraction between the two structures, indicating that within the linear deformation region at the beginning
TPMS optimization design has little effect on the forming of the compressive stress–strain curve. The quasi-
30
accuracy of additive manufacturing of lattice structures. elastic gradient is usually believed to be the modulus of
lattice structures. 38,39 In this study, Young’s modulus was
3.2. Static compression mechanical results calculated from the elastic region of (Figure 3A). As shown
3.2.1. Stress-strain in Table 2, Young’s moduli of the I-WP and the BCC lattice
structures were 250.74 MPa and 208.00 MPa, respectively.
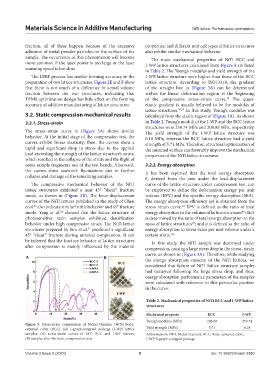
The stress–strain curve in (Figure 3A) shows similar The yield strength of the I-WP lattice structure was
behavior. At the initial stage of the compression test, the 6.18 MPa, whereas the BCC lattice structure had a yield
curves exhibit linear elasticity; then, the curves show a strength of 5.71 MPa. Therefore, structural optimization of
rapid and significant drop in stress due to the applied the minimal surface can favorably improve the mechanical
load exceeding the strength of the lattice structure’s struts, properties of the NiTi lattice structures.
which resulted in the collapse of the struts and the flight of
some sample fragments out of the test bench. Afterward, 3.2.2. Energy absorption
the curves show sawtooth fluctuations due to further It has been reported that the total energy absorption
collapse and damage of the remaining samples. €, derived from the area under the load-displacement
The compressive mechanical behavior of the NiTi curve of the lattice structure under compression test, can
lattice structures exhibited a near 45° “shear” fracture be employed to define the deformation energy per unit
mode, as shown in (Figure 3B). The force-displacement volume (EPV) and the specific energy absorption (SEA).
curves of the NiTi lattices published in the study of Chen The energy absorption efficiency (η) is obtained from the
et al. also indicate similar brittle behavior and 45° fracture stress–strain curve. EPV is defined as the ratio of total
24
36
mode. Yang et al. showed that the lattice structure of energy absorption to the volume of lattice structures ; SEA
24
40
photosensitive resin samples exhibited densification is determined by the ratio of total energy absorption to the
behavior under high compressive strain. The NiTi lattice mass of lattice structures ; and η is defined as the ratio of
41
structures prepared by Sun et al. produced a significant energy absorption to stress value per unit volume under a
37
45° “shear” fracture during uniaxial compression. It can certain strain. 42
be inferred that the fracture behavior of lattice structures In this study, the NiTi sample was destroyed under
after compression is mainly influenced by the material compression, causing a large stress drop in the stress–strain
curve, as shown in (Figure 3A). Therefore, while studying
A B
the energy absorption capacity of the NiTi lattices, we
considered that failure of NiTi lattice structure samples
had occurred following the large stress drop, and thus,
energy absorption performance parameters of the samples
were calculated with reference to this particular position
in the curve.
Table 2. Mechanical properties of NiTi BCC and I‑WP lattice
structures
Mechanical property BCC I‑WP
Young’s modulus (MPa) 208.00 250.74
Figure 3. Stress-strain compression of Nickel titanium (NiTi) body-
centered cubic (BCC) and I-graph-wrapped package (I-WP) lattice Yield strength (MPa) 5.71 6.18
samples: (A) stress-strain curves of NiTi BCC and I-WP lattices; Abbreviations: NiTi: Nickel titanium; BCC: Body-centered cubic;
(B) samples after the static compression tests. I-WP: I-graph-wrapped package.
Volume 3 Issue 2 (2024) 5 doi: 10.36922/msam.3380