
Page 106 - MSAM-3-2
P. 106
Materials Science in Additive Manufacturing NiTi lattice: Performance optimization
is characterized by the change of the minimum strain cycles corresponding to the abrupt strain point decreased
corresponding to the hysteresis curve of different cycles with the increase in stress levels.
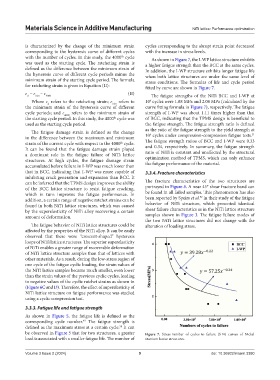
with the number of cycles. In this study, the 4000 cycle As shown in Figure 7, the I-WP lattice structure exhibits
th
was used as the starting cycle. The ratcheting strain is a higher fatigue strength than the BCC at the same cycles.
defined as the difference between the minimum strain of In addition, the I-WP structure exhibits longer fatigue life
the hysteresis curve of different cycle periods minus the when both lattice structures are under the same level of
minimum strain of the starting cycle period. The formula stress conditions. The formulas of life and cycle period
for ratcheting strain is given in Equation (II): fitted by curve are shown in Figure 7.
ɛ = ɛ – ɛ (II)
d min 4000 The fatigue strengths of the NiTi BCC and I-WP at
Where ɛ refers to the ratcheting strain; ɛ refers to 10 cycles were 1.88 MPa and 2.08 MPa (calculated by the
6
d
min
the minimum strain of the hysteresis curve of different curve fitting formula in Figure 7), respectively. The fatigue
cycle periods; and ɛ 4000 refers to the minimum strain of strength of I-WP was about 1.11 times higher than that
the starting cycle period. In this study, the 4000 cycle was of BCC, indicating that the TPMS design is beneficial to
th
used as the starting cycle period. the fatigue strength. The fatigue strength ratio is defined
The fatigue damage strain is defined as the change as the ratio of the fatigue strength to the yield strength at
51
6
in the difference between the maximum and minimum 10 cycles under compression-compression fatigue tests.
strain of the current cycle with respect to the 4000 cycle. The fatigue strength ratios of BCC and I-WP were 0.33
th
It can be found that the fatigue damage strain played and 0.34, respectively. In summary, the fatigue strength
a dominant role in the fatigue failure of NiTi lattice ratio of NiTi is constant and unaffected by the structural
structures. At high cycles, the fatigue damage strain optimization method of TPMS, which can only enhance
accumulated before failure in I-WP was much lower than the fatigue performance of the material.
that in BCC, indicating that I-WP was more capable of 3.3.4. Fracture characteristics
inhibiting crack generation and expansion than BCC. It
can be inferred that the TPMS design improves the ability The fracture characteristics of the two structures are
of the BCC lattice structure to resist fatigue cracking, portrayed in Figure 8. A near 45° shear fracture band can
which in turn improves the fatigue performance. In be found in all failed samples. This phenomenon has also
52
addition, a certain range of negative ratchet strains can be been reported by Speirs et al. in their study of the fatigue
found in both NiTi lattice structures, which was caused behavior of NiTi structure, which presented identical
by the superelasticity of NiTi alloy recovering a certain shear failure characteristics as in the NiTi lattice structure
amount of deformation. samples shown in Figure 3. The fatigue failure modes of
the two NiTi lattice structures did not change with the
The fatigue behavior of NiTi lattice structures could be alteration of loading stress.
affected by the properties of the NiTi alloy. It can be easily
observed that there were “crescent-shaped” hysteresis
loops of NiTi lattice structures. The superior superelasticity
of NiTi enables a greater range of recoverable deformation
of NiTi lattice structure samples than that of lattices with
other materials. As a result, during the low-stress region of
one cycle of the fatigue cyclic loading, the strain values of
the NiTi lattice samples became much smaller, even lower
than the strain values of the previous cyclic cycles, leading
to negative values of the cyclic ratchet strains as shown in
(Figure 6C and D). Therefore, the effect of superelasticity of
NiTi lattice structure on fatigue performance was studied
using a cyclic compression test.
3.3.3. Fatigue life and fatigue strength
As shown in Figure 5, the fatigue life is defined as the
corresponding cycle number. The fatigue strength is
49
defined as the maximum stress at a certain cycle. It can
50
be observed in Figure 5 that for two structures, a greater Figure 7. Stress-number of cycles to failure (S-N) curves of Nickel
load is associated with a smaller fatigue life. The number of titanium lattice structures.
Volume 3 Issue 2 (2024) 9 doi: 10.36922/msam.3380