
Page 104 - MSAM-3-2
P. 104
Materials Science in Additive Manufacturing NiTi lattice: Performance optimization
efficiency, when the lattice structure collapses and breaks, corresponding to this point decreased, indicating that a
24
the stress value as the denominator decreases sharply in smaller load could improve the fatigue life.
a small strain range, resulting in an inflection point and The curve bulge observed in the initial stage, as shown
a rapid rise in the energy absorption efficiency curve. It in (Figure 5A and B), is attributed to the instability of the
can be concluded that during compression, the lattice fatigue testing machine at the initial stage of operation.
structures improve the energy absorption efficiency
through the deformation of struts. Since the load ratio of the fatigue test was set to R = 0.1, the
minimum value of the load set in the test conditions was too
3.3. Fatigue performance small relative to the working load range of the equipment,
3.3.1. Strain accumulation so the fatigue test machine was unstable during the initial
operation cycles. The changes in applied load and indenter
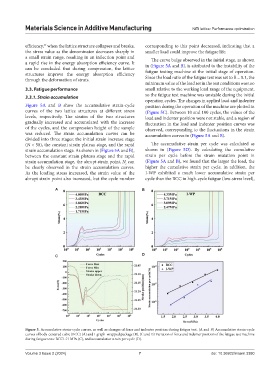
Figure 5A and B show the accumulative strain-cycle position during the operation of the machine are plotted in
curves of the two lattice structures at different stress (Figure 5C). Between 10 and 100 cycles, the values of the
levels, respectively. The strains of the two structures load and indenter position were not stable, and a region of
gradually increased and accumulated with the increase fluctuation in the load and indenter position curves was
of the cycles, and the compression height of the sample observed, corresponding to the fluctuations in the strain
was reduced. The strain accumulation curves can be accumulation curves in (Figure 5A and B).
divided into three stages: the initial strain increase stage
(N < 50), the constant strain plateau stage, and the rapid The accumulative strain per cycle was calculated as
strain accumulation stage. As shown in (Figure 5A and B), shown in (Figure 5D). By calculating the cumulative
between the constant strain plateau stage and the rapid strain per cycle before the strain mutation point in
strain accumulation stage, the abrupt strain point, N can (Figure 5A and B), we found that the larger the load, the
c
be clearly observed in the strain accumulation curves. higher the cumulative strain per cycle. In addition, the
As the loading stress increased, the strain value of the I-WP exhibited a much lower accumulative strain per
abrupt strain point also increased, but the cycle number cycle than the BCC in high-cycle fatigue (low-stress level),
A B
C D
Figure 5. Accumulative strain-cycle curves, as well as changes of force and indenter position during fatigue test. (A and B) Accumulative strain-cycle
curves of body-centered cubic (BCC) (A) and I-graph-wrapped package (B). (C and D) Variation of force and indenter position of the fatigue test machine
during fatigue tests: BCC1.71 MPa (C), and accumulative strain per cycle (D).
Volume 3 Issue 2 (2024) 7 doi: 10.36922/msam.3380