
Page 103 - MSAM-3-2
P. 103
Materials Science in Additive Manufacturing NiTi lattice: Performance optimization
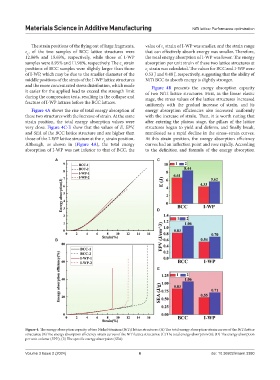
The strain positions of the flying out of large fragments, value of ε strain of I-WP was smaller, and the strain range
1
ε , of the two samples of BCC lattice structures were that can effectively absorb energy was smaller. Therefore,
1
12.86% and 15.69%, respectively, while those of I-WP the total energy absorption of I-WP was lower. The energy
samples were 8.95% and 11.98%, respectively. The ε strain absorption per unit strain of these two lattice structures at
1
positions of BCC samples were slightly larger than those ε strain was calculated. The values for BCC and I-WP were
1
of I-WP, which may be due to the smaller diameter of the 0.53 J and 0.48 J, respectively, suggesting that the ability of
middle positions of the struts of the I-WP lattice structures NiTi BCC to absorb energy is slightly stronger.
and the more concentrated stress distribution, which made Figure 4B presents the energy absorption capacity
it easier for the applied load to exceed the strength limit of two NiTi lattice structures. First, in the linear elastic
during the compression tests, resulting in the collapse and stage, the stress values of the lattice structures increased
fracture of I-WP lattices before the BCC lattices. uniformly with the gradual increase of strain, and its
Figure 4A shows the rise of total energy absorption of energy absorption efficiencies also increased uniformly
these two structures with the increase of strain. At the same with the increase of strain. Then, it is worth noting that
strain position, the total energy absorption values were after entering the plateau stage, the pillars of the lattice
very close. Figure 4C-E show that the values of E, EPV, structures began to yield and deform, and finally break,
and SEA of the BCC lattice structure and are higher than manifested as a rapid decline in the stress–strain curves.
those of the I-WP lattice structure at the ε strain position. At this strain position, the energy absorption efficiency
1
Although, as shown in (Figure 4A), the total energy curves had an inflection point and rose rapidly. According
absorption of I-WP was not inferior to that of BCC, the to the definition and formula of the energy absorption
A C
D
B
E
Figure 4. The energy absorption capacity of two Nickel titanium (NiTi) lattice structures: (A) The total energy absorption-strain curves of the NiTi lattice
structures; (B) The energy absorption efficiency-strain curves of the NiTi lattice structures; (C) The total energy absorption (E); (D) The energy absorption
per unit volume (EPV); (E) The specific energy absorption (SEA).
Volume 3 Issue 2 (2024) 6 doi: 10.36922/msam.3380