
Page 77 - MSAM-3-3
P. 77
Materials Science in Additive Manufacturing Gradient porous material design criteria
Table 1. Mechanical properties of Schon‑Gyroid‑sheet and Schwarz‑Diamond‑sheet uniform porosity materials
Porosity Young’s Yield stress Maximum Strain at the first Energy absorption at the
(%) modulus (GPa) (MPa) stress (MPa) stress drop (%) first stress drop (MJ/m )
3
Schon-Gyroid-sheet uniform porosity materials
50 29.10±0.32 342.36±2.65 412.06±2.37 13.38±0.22 41.95±1.33
60 23.99±0.13 248.95±3.69 291.72±3.70 12.92±0.12 27.57±3.56
70 19.91±0.66 168.27±7.65 195.88±7.58 12.58±0.63 18.46±1.35
80 14.01±0.26 104.12±1.26 121.61±3.89 8.55±0.85 7.73±0.69
90 8.66±0.11 53.59±4.67 60.22±3.28 6.43±0.15 3.12±0.07
Schwarz-Diamond-sheet uniform porosity materials
50 30.43±0.43 380.17±7.65 429.36±3.26 11.11±0.12 34.44±1.23
60 26.06±0.86 286.82±6.32 318.40±4.26 9.90±0.36 22.89±2.64
70 24.01±0.13 202.77±4.21 228.99±7.42 8.43±0.38 14.41±1.03
80 18.07±0.72 135.93±4.59 152.01±3.85 7.21±0.32 8.14±0.64
90 12.38±0.85 84.46±1.03 89.72±2.57 6.82±0.21 4.08±0.12
A B
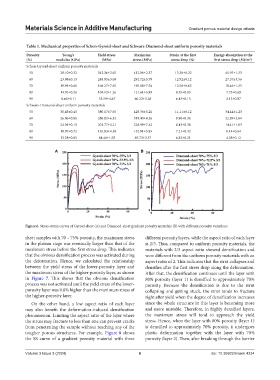
Figure 6. Stress-strain curves of Gyroid-sheet (A) and Diamond-sheet gradient porosity materials (B) with different porosity variations
sheet samples with 70 – 75% porosity, the maximum stress different porosity layers, while the aspect ratio of each layer
in the plateau stage was eventually larger than that of the is 2/3. Thus, compared to uniform porosity materials, the
maximum stress before the first stress drop. This indicates materials with 2/3 aspect ratio showed densification and
that the obvious densification process was activated during were different from the uniform porosity materials with an
the deformation. Hence, we calculated the relationship aspect ratio of 2. This indicates that the strut collapses and
between the yield stress of the lower-porosity layer and densifies after the first stress drop along the deformation.
the maximum stress of the higher-porosity layer, as shown After that, the densification continues until the layer with
in Figure 7. This shows that the obvious densification 80% porosity (layer 1) is densified to approximately 70%
process was not activated until the yield stress of the lower- porosity. Because the densification is due to the strut
porosity layer was 9.8% higher than the maximum stress of collapsing and getting stuck, the strut tends to fracture
the higher-porosity layer. right after yield when the degree of densification increases
On the other hand, a low aspect ratio of each layer since the whole structure in this layer is becoming more
may also benefit the deformation-induced densification and more unstable. Therefore, in highly densified layers,
phenomenon. Limiting the aspect ratio of the layer where the maximum stress will tend to approach the yield
the struts may fracture to less than one can prevent cracks stress. Hence, when the layer with 80% porosity (layer 1)
from penetrating the sample without reaching any of the is densified to approximately 70% porosity, it undergoes
tougher porous structures. For example, Figure 8 shows plastic deformation together with the layer with 70%
the SS curve of a gradient porosity material with three porosity (layer 2). Then, after breaking through the barrier
Volume 3 Issue 3 (2024) 6 doi: 10.36922/msam.4234