
Page 81 - MSAM-3-3
P. 81
Materials Science in Additive Manufacturing Gradient porous material design criteria
4 can be calculated and therefore can be expressed as
Equation 14.
W g = ρ σε + d ρ ∫ 1 ε 1 ρ ε σεd ρ ∫ 0 2 + 0 ε ρ2 3 σεd ρ ∫ 0 3 +
(σ σ + ) ∆ ρ
1 y y 2 × 12 × ll
/
2 ( − ρ 1 1 ) +∆ ρ 12 1 0
(σ + σ )
y
C ×− ε 2 σε d y 2 + y 2 y 3 × ∫ 0 (14)
2
∆ ρ
23 × ( + l 1 ' l 2 ) /l 0 − ε 3 y σε d y 3
1
( − ρ 2 ) +∆ ρ 23 ∫ 0
3.3. Coefficient C and prediction of the energy
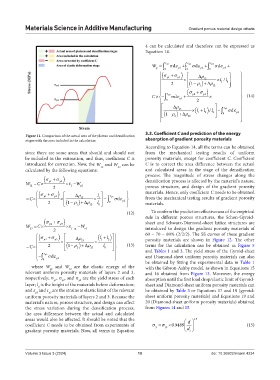
Figure 11. Comparison of the actual area of the plateau and densification
stages with the area included in the calculation absorption of gradient porosity materials
According to Equation 14, all the terms can be obtained
since there are some areas that should and should not from the mechanical testing results of uniform
be included in the estimation, and thus, coefficient C is porosity materials, except for coefficient C. Coefficient
introduced for correction. Now, the W and W can be C is to correct the area difference between the actual
12
23
calculated by the following equations: and calculated areas in the stage of the densification
(σ 1 y σ + y 2 ) process. The magnitude of stress changes along the
densification process is affected by the material’s nature,
= W × C × −ε W
12 1 2 e
2 porous structure, and design of the gradient porosity
(σ σ + ) ∆ ρ l materials. Hence, only coefficient C needs to be obtained
= × C 1 y y 2 × 12 × 1 − ε 2y σε d y 2 from the mechanical testing results of gradient porosity
2 ( − ρ 1 1 ) +∆ ρ 12 l 0 ∫ 0 materials.
To confirm the prediction effectiveness of the empirical
(12) rule in different porous structures, the Schon-Gyroid-
(σ + σ ) sheet and Schwarz-Diamond-sheet lattice structures are
= W C × y 2 y 3 × −ε W
23 2 12 3 e introduced to design the gradient porosity materials of
'
+
(σ + σ ) ( + l ) 60 – 70 – 80% (2/2/2). The SS curves of these gradient
l
'
y 2 y 3 × ∆ ρ 23 × 1 2 porosity materials are shown in Figure 12. The other
= × C 2 ( 1 − ρ 2 ) +∆ ρ 23 l 0 (13) terms for the calculation can be obtained in Figure 5
and Tables 1 and 3. The yield stress of the Gyroid-sheet
y
− ε 3 σε d and Diamond-sheet uniform porosity materials can also
∫ 0 y 3 be obtained by fitting the experimental data in Table 1
where W and W are the elastic energy of the with the Gibson-Ashby model, as shown in Equations 15
e3
e2
relevant uniform porosity materials of layers 2 and 3, and 16 obtained from Figure 13. Moreover, the energy
respectively; σ , σ , and σ are the yield stress of each absorption until the first load drop/elastic limit of Gyroid-
y3
y1
y2
layer; l is the height of the materials before deformation; sheet and Diamond-sheet uniform porosity materials can
0
and ε and ε are the strains at elastic limit of the relevant be obtained by Table 3 or Equations 17 and 18 (gyroid-
y2
y3
uniform porosity materials of layers 2 and 3. Because the sheet uniform porosity materials) and Equations 19 and
material’s nature, porous structure, and design can affect 20 (Diamond-sheet uniform porosity materials) obtained
the stress variation during the densification process, from Figures 14 and 15.
the area difference between the actual and calculated
areas would also be affected. It should be noted that the d 15.
coefficient C needs to be obtained from experiments of σ = σ ×0 9489. (15)
y
ys
gradient porosity materials. Now, all terms in Equation d s
Volume 3 Issue 3 (2024) 10 doi: 10.36922/msam.4234