
Page 84 - MSAM-3-3
P. 84
Materials Science in Additive Manufacturing Gradient porous material design criteria
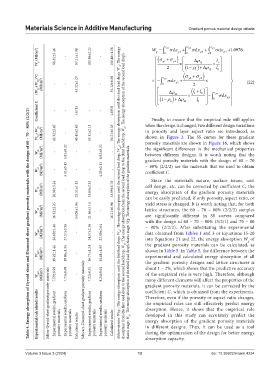
W g (MJ/m 3 ) 98.81±3.46 - 103.36±2.25 - 100.48±1.38 W 97.11±1.98 g (σ = 1 y ρ σε + σ + d y 2 ) ρ ∫ 1 × ε 1 ρ ε σεd ρ 12 ρ ∫ 0 2 + 0 ε ρ 2 × 3 σεd ρ ∫ 0 3 + 1.0976
l
∆
1
2 (σ ( − ρ 1 + 1 σ ) +∆ ρ 12 l 0
)
(W 12 +W 23 )*C (MJ/m 3 ) - - - - ×− ε 2 y σε y 2 + y 2 ( + l y 3 ) 43.32±1.07 × ∫ 0 (22)
55.12±0.98
d
2
l
'
∆
ρ
23
( 1 − ρ 2 ) +∆ ρ 23 × 1 l 0 2 − ∫ 0 ε 3 y σε d y 3
Coefficient C - - 1.0715 - - 1.0976 Finally, to ensure that the empirical rule still applies
Table 4. Energy absorption of Gyroid‑sheet and Diamond‑sheet gradient porosity materials with the design of 60 – 70 – 80% (2/2/2)
W 12 +W 23 (MJ/m 3 ) 43.32±2.45 - 40.43±2.45 55.11±2.11 - 50.21±0.56 when the design is changed, two different design variations
in porosity and layer aspect ratio are introduced, as
shown in Figure 3. The SS curves for these gradient
porosity materials are shown in Figure 16, which shows
elastic stage; W e3 : The energy absorption of the third load drop’s elastic stage; Wg: The energy absorption of the gradient materials.
W e3 (MJ/m 3 ) - 5.82±0.32 - - 6.92±0.32 - the significant differences in the mechanical properties
between different designs. It is worth noting that the
gradient porosity materials with the design of 60 – 70
W e2 (MJ/m 3 ) - 3.41±0.45 - - 4.05±0.11 - – 80% (2/2/2) are the materials that we used to obtain
coefficient C.
Since the material’s nature, surface issues, unit
W 23 (MJ/m 3 ) 26.98±3.24 - 25.51±1.13 33.64±2.32 - 33.99±0.76 Abbreviations: Wuρ 1 : The energy absorption until the first load drop; W u2 : The energy absorption until the second load drop; W uρ3 : The energy absorption until the third load drop; W 12 : The energy absorption from the first load drop to the second load drop; W 23 : The energy absorption from the second load drop to the third load drop; W e2 : The energy absorption of the secon
energy absorption of the gradient porosity materials
can be easily predicted, if only porosity, aspect ratio, or
lattice structures, the 60 – 70 – 80% (2/2/2) samples
W 12 (MJ/m 3 ) 16.32±2.25 - 14.09±1.04 21.46±1.14 - 16.21±0.98 yield stress is changed. It is worth noting that, for both
are significantly different in SS curves compared
with the design of 60 – 70 – 80% (3/2/1) and 70 – 80
W uρ2 (MJ/m 3 ) 28.68±1.46 27.57±3.56 - 24.57±2.36 22.89±2.64 - – 90% (2/2/2). After substituting the experimental
data obtained from Tables 1 and 3 or Equations 15-20
into Equations 21 and 22, the energy absorption W of
g
the gradient porosity materials can be calculated, as
W uρ3 (MJ/m 3 ) 19.22±1.42 18.46±1.35 - 16.77±1.24 14.41±1.03 - shown in Table 5. In Table 5, the difference between the
experimental and calculated energy absorption of all
the gradient porosity designs and lattice structures is
W uρ1 (MJ/m 3 ) 7.59±0.93 7.73±0.69 - 7.22±0.51 8.24±0.64 - about 1 – 2%, which shows that the predictive accuracy
of the empirical rule is very high. Therefore, although
many different elements will affect the properties of the
gradient porosity materials, it can be corrected by the
coefficient C, which is obtained from the experiments.
Experimental/calculated results Schon-Gyroid-sheet gradient porosity materials Experimental results, gradient porosity materials Experimental results, uniform porosity materials Calculated results Schwarz-Diamond-sheet gradient porosity materials Experimental results, gradient porosity materials Experimental results, uniform porosity materials Calculated results Therefore, even if the porosity or aspect ratio changes,
the empirical rules can still effectively predict energy
absorption. Hence, it shows that the empirical rule
developed in this study can accurately predict the
energy absorption of the gradient porosity materials
in different designs. Thus, it can be used as a tool
during the optimization of the design for better energy
Volume 3 Issue 3 (2024) 13 absorption capacity. doi: 10.36922/msam.4234