
Page 79 - MSAM-3-3
P. 79
Materials Science in Additive Manufacturing Gradient porous material design criteria
Table 2. Mechanical properties of Schwarz‑Gyroid‑sheet 60 – 70 – 80% (2/2/2) gradient porosity materials and uniform porosity
materials
Sample Yield stress Maximum Strain Energy absorption
(MPa) stress (MPa) (%) (MJ/m )
3
Uniform 80% porosity materials, until the first major stress drop 104.12±1.26 121.61±3.89 8.55±0.85 7.73±0.69
Uniform 70% porosity materials, until the first major stress drop 168.27±7.65 195.88±7.58 12.58±0.63 18.46±1.35
Uniform 60% porosity materials, until the first major stress drop 248.95±3.69 291.72±3.70 12.92±0.12 27.57±3.56
Gradient porosity materials 107±2.24 283.47±4.52 60.12±0.24 98.81±3.46
Gradient porosity materials, until the first major stress drop 107±2.24 131.47±5.63 7.94±0.35 7.59±0.93
Gradient porosity materials, within the second major stress drop - 196.43±3.42 10.85±0.42 19.22±1.42
Gradient porosity materials, within the third major stress drop - 283.47±4.52 10.69±0.36 28.68±1.46
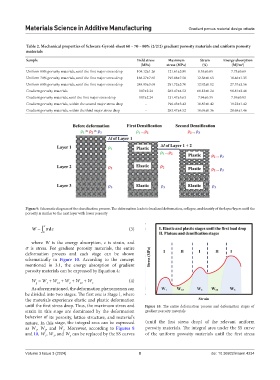
Figure 9. Schematic diagram of the densification process. The deformation leads to localized deformation, collapse, and densify of the layer/layers until the
porosity is similar to the next layer with lower porosity
ε
W = σεd (3)
∫ 0
where W is the energy absorption, ε is strain, and
s is stress. For gradient porosity materials, the entire
deformation process and each stage can be shown
schematically in Figure 10. According to the concept
mentioned in 3.1, the energy absorption of gradient
porosity materials can be expressed by Equation 4:
W = W + W + W + W + W 3 (4)
23
g
2
12
1
As aforementioned, the deformation phenomenon can
be divided into two stages. The first one is Stage I, where
the materials experience elastic and plastic deformation
until the first stress drop. Thus, the maximum stress and Figure 10. The entire deformation process and deformation stages of
strain in this stage are dominated by the deformation gradient porosity materials
behavior of its porosity, lattice structure, and material’s
nature. In this stage, the integral area can be expressed (until the first stress drop) of the relevant uniform
as W , W , and W . Moreover, according to Figures 8 porosity materials. The integral area under the SS curve
3
2
1
and 10, W , W , and W can be replaced by the SS curves of the uniform porosity materials until the first stress
3
2
1
Volume 3 Issue 3 (2024) 8 doi: 10.36922/msam.4234