
Page 130 - MSAM-4-3
P. 130
Materials Science in Additive Manufacturing 3D-Printed hip joints performance
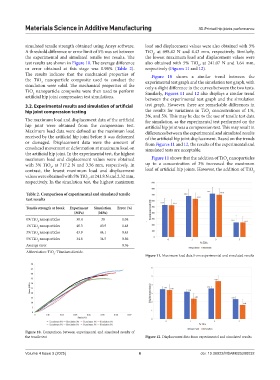
simulated tensile strength obtained using Ansys software. load and displacement values were also obtained with 3%
A threshold difference or error limit of 5% was set between TiO , at 698.42 N and 4.43 mm, respectively. Similarly,
2
the experimental and simulated tensile test results. The the lowest maximum load and displacement values were
test results are shown in Figure 10. The average difference also obtained with 5% TiO , at 241.07 N and 1.64 mm,
2
or error obtained at this stage was 0.96% (Table 2). respectively (Figures 11 and 12).
The results indicate that the mechanical properties of Figure 10 shows a similar trend between the
the TiO nanoparticle composite used to conduct the experimental test graph and the simulation test graph, with
2
simulation were valid. The mechanical properties of the only a slight difference in the curves between the two tests.
TiO nanoparticle composite were then used to perform Similarly, Figures 11 and 12 also displays a similar trend
2
artificial hip joint compression test simulations. between the experimental test graph and the simulation
3.2. Experimental results and simulation of artificial test graph. However, there are remarkable differences in
hip joint compression testing the results for variations in TiO concentrations of 1%,
2
3%, and 5%. This may be due to the use of tensile test data
The maximum load and displacement data of the artificial for simulation, as the experimental test performed on the
hip joint were obtained from the compression test. artificial hip joint was a compression test. This may result in
Maximum load data were defined as the maximum load differences between the experimental and simulated results
received by the artificial hip joint before it was deformed of the artificial hip joint displacement. Based on the trends
or damaged. Displacement data were the amount of from Figures 11 and 12, the results of the experimental and
crosshead movement or deformation at maximum load on simulated tests are acceptable.
the artificial hip joint. In the experimental test, the highest
maximum load and displacement values were obtained Figure 11 shows that the addition of TiO nanoparticles
2
with 3% TiO , at 717.2 N and 3.56 mm, respectively. In up to a concentration of 3% increased the maximum
2
contrast, the lowest maximum load and displacement load of artificial hip joints. However, the addition of TiO
2
values were obtained with 5% TiO , at 241.8 N and 2.32 mm,
2
respectively. In the simulation test, the highest maximum
Table 2. Comparison of experimental and simulated tensile
test results
Tensile strength at break Experiment Simulation Error (%)
(MPa) (MPa)
0% TiO nanoparticles 38.4 38 1.04
2
1% TiO nanoparticles 40.3 40.9 1.48
2
3% TiO nanoparticles 43.9 44.1 0.45
2
5% TiO nanoparticles 34.8 34.5 0.86
2
Average error 0.96
Abbreviation: TiO : Titanium dioxide.
2
Figure 11. Maximum load data from experimental and simulated results
Figure 10. Comparison between experimental and simulated results of
the tensile test Figure 12. Displacement data from experimental and simulated results
Volume 4 Issue 3 (2025) 6 doi: 10.36922/MSAM025200032