
Page 92 - OR-1-1
P. 92
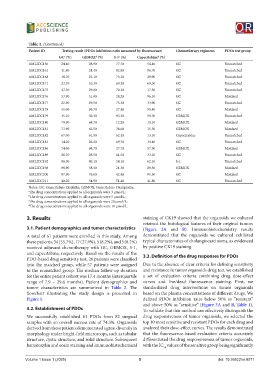
Table 1. (Continued)
             Patient ID    Testing result (PDOs inhibition ratio measured by fluorescence)  Chemotherapy regimens  PDOs test group
                          GC  (%)   GEMOX  (%)   S‑1  (%)  Capecitabine  (%)
                                                    c
                                                                    d
                            a
                                          b
             AMLICC156     24.40       28.90      77.70         54.40       GC                   Unmatched
             AMLICC161     41.80       24.40      82.80         96.70       GC                   Unmatched
             AMLICC168     18.70       22.10      75.10         29.90       GC                   Unmatched
             AMLICC171     23.70       10.30      69.30         69.30       GC                   Unmatched
             AMLICC175     43.30       29.80      70.10         17.50       GC                   Unmatched
             AMLICC176     53.90       51.80      28.20         96.10       GC                   Matched
             AMLICC177     22.90       29.50      75.30         33.90       GC                   Unmatched
             AMLICC178     55.00       96.70      27.40         59.40       GC                   Matched
             AMLICC179     35.10       30.40      93.30         59.30       GEMOX                Unmatched
             AMLICC180     79.90       68.70      12.20         19.10       GEMOX                Matched
             AMLICC181     73.90       62.50      38.60         15.30       GEMOX                Matched
             AMLICC182     67.00       61.90      62.40         13.10       Capecitabine         Unmatched
             AMLICC183     14.20       26.20      69.70         30.40       GC                   Unmatched
             AMLICC186     74.00       68.70      27.70         57.50       GEMOX                Matched
             AMLICC189     26.70       28.50      61.50         33.10       GC                   Unmatched
             AMLICC192     86.90       80.10      24.10         62.10       S-1                  Unmatched
             AMLICC198     88.90       58.40      21.30         89.50       GEMOX                Matched
             AMLICC200     87.90       76.60      42.40         95.50       GC                   Matched
             AMLICC211     40.20       34.90      51.40         41.80       GC                   Unmatched
             Notes: GC: Gemcitabin+Cisplatin; GEMOX: Gemcitabin+Oxaliplatin;
             a The drug concentrations applied to all organoids were 3 μmol/L;
             b The drug concentrations applied to all organoids were 5 μmol/L;
             c The drug concentrations applied to all organoids were 20 μmol/L;
             d The drug concentrations applied to all organoids were 10 μmol/L.

            3. Results                                        staining of CK19 showed that the organoids we cultured
                                                              retained the histological features of their original tumors
            3.1. Patient demographics and tumor characteristics  (Figure  2A  and  B).  Immunohistochemistry  results
            A total of 61 patients were enrolled in this study. Among   demonstrated that  the  organoids we  cultured exhibited
            these patients, 34 (55.7%), 17 (27.9%), 5 (8.2%), and 5 (8.2%)   typical characteristics of cholangiocarcinoma, as evidenced
            received adjuvant chemotherapy with GC, GEMOX, S-1,   by positive CK19 staining.
            and capecitabine, respectively. Based on the results of the   3.3. Definition of the drug responses for PDOs
            PDO-based drug sensitivity test, 26 patients were classified
            into the matched group, while 57 patients were assigned   Due to the absence of clear criteria for defining sensitivity
            to the unmatched group. The median follow-up duration   and resistance in tumor organoids drug test, we established
            for the entire patient cohort was 17.4 months (interquartile   a set of evaluation criteria combining drug dose-effect
            range of 7.9 – 29.6  months). Patient demographics and   curves and live/dead fluorescence staining. First, we
            tumor characteristics are summarized in  Table 2. The   standardized drug interventions on tumor organoids
            flowchart  illustrating  the  study  design  is  presented  in   based on the plasma concentrations of different drugs. We
            Figure 1.                                         defined PDOs inhibition ratio below 50% as “resistant”
                                                              and above 50% as “sensitive” (Figure 3A and B, Table 1).
            3.2. Establishment of PDOs                        To validate that this method can effectively distinguish the
            We successfully established 61 PDOs from 82 surgical   drug responsiveness of tumor organoids, we selected the
            samples with an overall success rate of 74.3%. Organoids   top 10 most sensitive and resistant PDOs for each drug and
            derived from these patients demonstrated a great diversity in   analyzed their dose-effect curves. The results demonstrated
            morphology under bright-field microscopy, such as tubular   that the fluorescence-based evaluation criteria accurately
            structure, cystic structure, and solid structure. Subsequent   differentiated the drug responsiveness of tumor organoids,
            hematoxylin and eosin staining and immunohistochemical   with the IC  values of the sensitive group being significantly
                                                                       50

            Volume 1 Issue 1 (2025)                         5                                 doi: 10.36922/or.8571