
Page 95 - OR-1-1
P. 95
A B
C
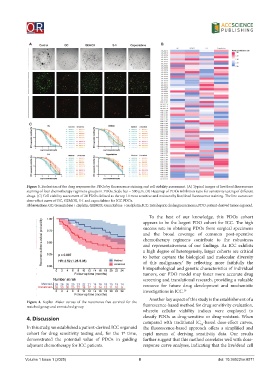
Figure 3. Evaluation of the drug responses for PDOs by fluorescence staining and cell viability assessment. (A) Typical images of live/dead fluorescence
staining of four chemotherapy regimens groups in PDOs. Scale bar = 500 μm. (B) Heatmap of PDOs inhibition ratio for sensitivity testing of different
drugs. (C) Cell viability assessment of 20 PDOs defined as the top 10 most sensitive and resistant by live/dead fluorescence staining. The line curves are
dose-effect curve of GC, GEMOX, S-1 and capecitabine for ICC PDOs.
Abbreviations: GC: Gemcitabine + cisplatin; GEMOX: Gemcitabine + oxaliplatin; ICC: Intrahepatic cholangiocarcinoma; PDO: patient-derived tumor organoid.
To the best of our knowledge, this PDOs cohort
appears to be the largest PDO cohort for ICC. The high
success rate in obtaining PDOs from surgical specimens
and the broad coverage of common post-operative
chemotherapy regimens contribute to the robustness
and representativeness of our findings. As ICC exhibits
a high degree of heterogeneity, larger cohorts are critical
to better capture the biological and molecular diversity
of this malignancy. By reflecting more faithfully the
4
histopathological and genetic characteristics of individual
tumors, our PDO model may foster more accurate drug
screening and translational research, providing a valuable
resource for future drug development and mechanistic
investigations in ICC. 16
Another key aspect of this study is the establishment of a
Figure 4. Kaplan–Meier curves of the recurrence-free survival for the
matched group and unmatched group fluorescence-based method for drug sensitivity evaluation,
wherein cellular viability indices were employed to
4. Discussion classify PDOs as drug-sensitive or drug-resistant. When
compared with traditional IC -based dose-effect curves,
50
In this study, we established a patient-derived ICC organoid the fluorescence-based approach offers a simplified and
cohort for drug sensitivity testing and, for the 1 time, rapid means of deriving sensitivity data. Our results
st
demonstrated the potential value of PDOs in guiding further suggest that this method correlates well with dose-
adjuvant chemotherapy for ICC patients. response curve analyses, indicating that the live/dead cell
Volume 1 Issue 1 (2025) 8 doi: 10.36922/or.8571