
Page 12 - OR-1-3
P. 12
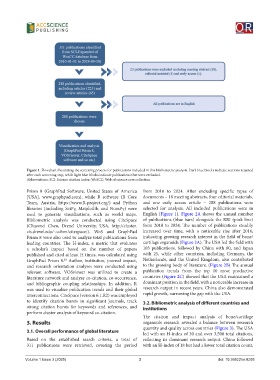
Figure 1. Flowchart illustrating the screening process for publications included in this bibliometric analysis. Dark blue blocks indicate sections retained
            after each screening step, while light blue blocks indicate publications that were excluded.
            Abbreviations: SCI: Science citation index; WoSCC: Web of science core collection.

            Prism 8 (GraphPad Software, United States of America   from 2010 to 2024. After excluding specific types of
            [USA], www.graphpad.com), while R software (R Core   documents – 18 meeting abstracts, four editorial materials,
            Team, Austria, https://www.R-project.org/) and Python   and one early access article – 288 publications were
            libraries (including SciPy, Matplotlib, and NumPy) were   selected for analysis. All included publications were in
            used to generate visualizations, such as world maps.   English (Figure  1).  Figure  2A shows the annual number
            Bibliometric analysis was conducted using CiteSpace   of publications (blue bars) alongside the RRI (pink line)
            (Chaomei  Chen,  Drexel  University,  USA,  http://cluster.  from 2010 to 2024. The number of publications steadily
            cis.drexel.edu/~cchen/citespace/). WoS and  GraphPad   increased over time, with a noticeable rise after 2016,
            Prism 8 were also used to analyze total publications from   indicating growing research interest in the field of bone/
            leading countries. The H-index, a metric that evaluates   cartilage organoids (Figure 2A). The USA led the field with
            a scholar’s impact based on the number of papers   103 publications, followed by China with 80, and Japan
            published and cited at least H times, was calculated using   with 25, while other countries, including Germany, the
            GraphPad Prism 8.  Author, institution, journal impact,   Netherlands, and the United  Kingdom, also contributed
                            24
            and research orientation analyses were conducted using   to the growing body of literature. (Figure 2B) The annual
            relevant  software.  VOSviewer  was  utilized  to  create  a   publication  trends  from  the  top  10  most  productive
            literature network and analyze co-citation, co-occurrence,   countries (Figure 2C) showed that the USA maintained a
            and bibliographic coupling relationships. In addition, R   dominant position in the field, with a noticeable increase in
            was used to visualize publication trends and their global   research output in recent years. China also demonstrated
            interconnections. CiteSpace (version 6.1.R2) was employed   rapid growth, narrowing the gap with the USA.
            to identify citation bursts in significant journals, track   3.2. Bibliometric analysis of different countries and
            strong citation bursts for keywords and references, and   institutions
            perform cluster analysis of keyword co-citation.
                                                              The citation and impact analysis of bone/cartilage
            3. Results                                        organoids research revealed a balance between research
                                                              quantity and quality across countries (Figure 3). The USA
            3.1. Overall performance of global literature
                                                              led with an H-index of 30 and over 3,500 total citations,
            Based on the established search criteria, a total of   reflecting  its  dominant research  output.  China  followed
            311  publications were retrieved, covering the period   with an H-index of 18 but had a lower total citation count,


            Volume 1 Issue 3 (2025)                         3                                 doi: 10.36922/or.8295