
Page 121 - AIH-1-4
P. 121
Artificial Intelligence in Health Complex early diagnosis of MS through machine learning
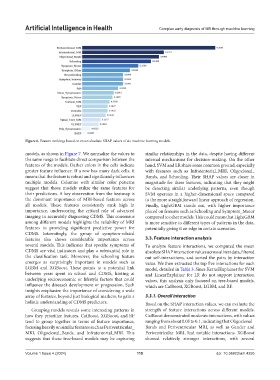
Figure 6. Feature rankings based on mean absolute SHAP values of six machine learning models.
models, as shown in Figure 7. We normalize the values to similar relationships in the data, despite having different
the same range to facilitate direct comparison between the internal mechanisms for decision-making. On the other
features of the models. Darker colors in the cells indicate hand, SVM and LR share some common ground, especially
greater feature influence. If a row has many dark cells, it with features such as Infratentorial_MRI, Oligoclonal_
means that the feature is robust and significantly influences Bands, and Schooling. Their SHAP values are closer in
multiple models. Columns with similar color patterns magnitude for these features, indicating that they might
suggest that those models utilize the same features for be detecting similar underlying patterns, even though
their predictions. A key observation from the heatmap is SVM operates in a higher-dimensional space compared
the dominant importance of MRI-based features across to the more straightforward linear approach of regression.
all models. These features consistently rank high in Finally, LightGBM stands out, with higher importance
importance, underscoring the critical role of advanced placed on features such as Schooling and Symptom_Motor
imaging in accurately diagnosing CDMS. This consensus compared to other models. This could mean that LightGBM
among different models highlights the reliability of MRI is more sensitive to different types of patterns in the data,
features in providing significant predictive power for potentially giving it an edge in certain scenarios.
CDMS. Interestingly, the group of symptom-related
features also shows considerable importance across 3.3. Feature interaction analysis
several models. This indicates that specific symptoms of To analyze feature interactions, we computed the mean
CDMS are vital indicators and play a substantial role in absolute SHAP interaction values across all test data, filtered
the classification task. Moreover, the schooling feature out self-interactions, and sorted the pairs by interaction
emerges as surprisingly important in models such as value. We then extracted the top five interactions for each
LGBM and XGBoost. These points to a potential link model, detailed in Table 3. Since KernelExplainer for SVM
between years spent in school and CDMS, hinting at and LinearExplainer for LR do not support interaction
underlying socioeconomic or lifestyle factors that could values, this analysis only focused on tree-based models,
influence the disease’s development or progression. Such which are CatBoost, XGBoost, LGBM, and RF.
insights emphasize the importance of considering a wide
array of features, beyond just biological markers, to gain a 3.3.1. Overall interaction
holistic understanding of CDMS predictors. Based on the SHAP interaction values, we can evaluate the
Grouping models reveals some interesting patterns in strength of feature interactions across different models.
how they prioritize features. CatBoost, XGBoost, and RF CatBoost demonstrated moderate interactions, with values
tend to group together in terms of feature importance, ranging from about 0.05 to 0.1, indicating that Oligoclonal_
focusing heavily on similar features such as Periventricular_ Bands and Periventricular_MRI, as well as Gender and
MRI, Oligoclonal_Bands, and Infratentorial_MRI. This Periventricular_MRI, had notable interactions. XGBoost
suggests that these tree-based models may be capturing showed relatively stronger interactions, with several
Volume 1 Issue 4 (2024) 115 doi: 10.36922/aih.4255