
Page 122 - AIH-1-4
P. 122
Artificial Intelligence in Health Complex early diagnosis of MS through machine learning
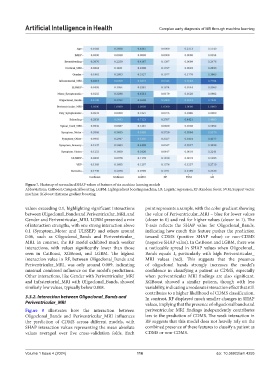
Figure 7. Heatmap of normalized SHAP values of features of six machine learning models
Abbreviations: CatBoost: Categorical boosting; LGBM: Light gradient boosting machine; LR: Logistic regression; RF: Random forest; SVM: Support vector
machine; XGBoost: Extreme gradient boosting.
values exceeding 0.1, highlighting significant interactions point represents a sample, with the color gradient showing
between Oligoclonal_Bands and Periventricular_MRI, and the value of Periventricular_MRI – blue for lower values
Gender and Periventricular_MRI. LGBM presented a mix (closer to 0) and red for higher values (closer to 1). The
of interaction strengths, with one strong interaction above Y-axis reflects the SHAP value for Oligoclonal_Bands,
0.1 (Symptom_Motor and ULSSEP) and others around indicating how much this feature pushes the prediction
0.06, such as Oligoclonal_Bands and Periventricular_ toward CDMS (positive SHAP value) or non-CDMS
MRI. In contrast, the RF model exhibited much weaker (negative SHAP value). In CatBoost and LGBM, there was
interactions, with values significantly lower than those a noticeable spread in SHAP values when Oligoclonal_
seen in CatBoost, XGBoost, and LGBM. The highest Bands equals 1, particularly with high Periventricular_
interaction value in RF, between Oligoclonal_Bands and MRI values (red). This suggests that the presence
Periventricular_MRI, was only around 0.009, indicating of oligoclonal bands strongly increases the model’s
minimal combined influence on the model’s predictions. confidence in classifying a patient as CDMS, especially
Other interactions, like Gender with Periventricular_MRI when periventricular MRI findings are also significant.
and Infratentorial_MRI with Oligoclonal_Bands, showed XGBoost showed a similar pattern, though with less
similarly low values, typically below 0.008. variability, indicating a moderate interaction effect that still
contributes to a higher likelihood of CDMS classification.
3.3.2. Interaction between Oligoclonal_Bands and In contrast, RF displayed much smaller changes in SHAP
Periventricular_MRI values, implying that the presence of oligoclonal bands and
Figure 8 illustrates how the interaction between periventricular MRI findings independently contributes
Oligoclonal_Bands and Periventricular_MRI influences less to the prediction of CDMS. The weak interaction in
the prediction of CDMS across different models, with RF suggests that this model does not heavily rely on the
SHAP interaction values representing the mean absolute combined presence of these features to classify a patient as
values averaged over five cross-validation folds. Each CDMS or non-CDMS.
Volume 1 Issue 4 (2024) 116 doi: 10.36922/aih.4255