
Page 100 - AJWEP-22-6
P. 100
Li, et al.
532.1eV corresponding to Sb of Sb O , indicating the A
5+
5
2
coexistence of Sb and Sb in the SbY-1 sample. The
36
5+
3+
peak area of Sb is smaller than that of Sb , indicating
5+
3+
that the Sb(III)Y in the SbY-1 is the dominant phase.
In the Zr 3d spectrum, peaks at 182.5 eV (3d ) and B
5/2
185 eV (3d ) are attributed to Zr for the ZrOCl ·8H O
4+
2
3/2
2
and bulk ZrO . The peaks at 182.7 eV (3d ) and
37
5/2
2
185.2eV(3d ) for the ZrY-1 are shifted slightly by C
3/2
0.2eV toward higher binding energy, and are attributed
to Zr . Similar to RuY-1, the Zr species may exist
4+
4+
as ZrOₓ cluster ions in ZrY-1. In the Bi 4f spectrum of
BiY-1, the peaks at 159.8 eV (4f ) and 165.2 eV (4f ) D
7/2
5/2
are attributed to Bi , consistent with Bi(NO ) ·5H O
3+
2
3 3
and BiOCl references. 38
These findings indicate oxidation of the metal
species occurred in the RuY-1and SbY-1 samples
during the calcinations at 500°C, but not in the ZrY-1
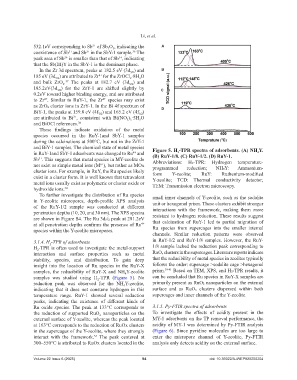
and BiY-1 samples. The chemical state of metal species Figure 5. H -TPR spectra of adsorbents. (A) NH Y.
in RuY-1and SbY-1 adsorbents was changed to Ru and (B) RuY-1/8. (C) RuY-1/2. (D) RuY-1. 4
2
4+
Sb . This suggests that metal species in MY-zeolite do Abbreviations: H₂-TPR: Hydrogen temperature-
5+
not exist as simple metal ions (M ), but rather as MOx programmed reduction; NH₄Y: Ammonium-
n+
cluster ions. For example, in RuY, the Ru species likely form Y-zeolite; RuY: Ruthenium-modified
exist in a cluster form. It is well known that tetravalent Y-zeolite; TCD: Thermal conductivity detector;
metal ions usually exist as polymeric or cluster oxide or TEM: Transmission electron microscopy.
hydroxide ions. 34
To further investigate the distribution of Ru species small inner channels of Y-zeolite, such as the sodalite
in Y-zeolite micropores, depth-profile XPS analysis unit or hexagonal prism. These clusters exhibit stronger
of the RuY-1/2 sample was conducted at different interactions with the framework, making them more
penetration depths (10, 20, and 30 nm). The XPS spectra resistant to hydrogen reduction. These results suggest
are shown in Figure S4. The Ru 3d₅/₂ peak at 281.2eV
at all penetration depths confirms the presence of Ru that calcination of RuY-1 led to partial migration of
4+
species within the Y-zeolite micropores. Ru species from supercages into the smaller internal
channels. Similar reduction patterns were observed
3.1.4. H -TPR of adsorbents in RuY-1/2 and RuY-1/8 samples. However, the RuY-
2
H -TPR is often used to investigate the metal-support 1/8 sample lacked the reduction peak corresponding to
2
interaction and surface properties such as metal RuOₓ clusters in the supercages. Literature reports indicate
stability, species, and distribution. To gain deep that the reducibility of metal species in zeolites typically
insight into the location of Ru species in the RuY-X follows the order: supercage >sodalite cage >hexagonal
samples, the reducibility of RuY-X and NH Y-zeolite prism. 39-41 Based on TEM, XPS, and H₂-TPR results, it
4
samples was studied using H -TPR (Figure 5). No can be concluded that Ru species in RuY-X samples are
2
reduction peak was observed for the NH Y-zeolite, primarily present as RuO₂ nanoparticles on the external
4
indicating that it does not consume hydrogen in this surface and as RuOₓ clusters dispersed within both
temperature range. RuY-1 showed several reduction supercages and inner channels of the Y-zeolite.
peaks, indicating the existence of different kinds of
Ru oxide species. The peak at 133°C corresponds to 3.1.5. Py-FTIR spectra of adsorbents
the reduction of supported RuO nanoparticles on the To investigate the effects of acidity present in the
2
external surface of Y-zeolite, whereas the peak located MY-1 adsorbents on the TP removal performance, the
at 163°C corresponds to the reduction of RuOx clusters acidity of MY-1 was determined by Py-FTIR analysis
in the supercages of the Y-zeolite, where they strongly (Figure 6). Since pyridine molecules are too large to
interact with the framework. The peak centered at enter the micropore channel of Y-zeolite, Py-FTIR
33
300–550°C is attributed to RuOx clusters located in the analysis only detects acidity on the external surface.
Volume 22 Issue 6 (2025) 94 doi: 10.36922/AJWEP025250204