
Page 101 - AJWEP-22-6
P. 101
Adsorption desulfurization
Two types of acid sites were identified on the external where L and B are the concentrations of Lewis acid
surface of MY-1: one peak at 1540 cm corresponding and Brønsted acid (mol/g), respectively, and A and A
-1
B
L
to the vibration of pyridine molecules bound at Brønsted are the absorbance intensity at 1450 cm and 1540 cm ,
-1
-1
acid sites and the other peak at 1450 cm attributed to respectively. 44
-1
the ring C-C stretching vibration of pyridine adsorbed The T of the MY-1 external surface follows the
on Lewis acid sites. Another intense band was observed order: SbY-1 >ZrY-1 >BiY-1 >RuY-1. For all samples,
at 1490 cm , arising from the combined presence of the Brønsted acid site concentration (T ) was greater
-1
B
Lewis acidic and Brønsted acid sites. 42,43 These results than that of Lewis acid sites (T ). SbY-1 exhibited the
L
indicate that MY-1 adsorbents possess both Lewis strongest acidity, consistent with the XRD analysis,
acidic and Brønsted acid sites, suggesting that the which identified SbY as its main crystalline phase.
incorporation of metal ions modifies the acidity of the These findings suggest that the acidity of MY-1’s
adsorbent surfaces. external surface is mainly contributed by the metal ions
Quantitative data on acid site concentrations are within the MY structure, whereas the M O contributes
x
y
presented in Table 1. The total acidity (T) and strong minimally. RuY-1 sample exhibited the weakest acidity,
acidity (S) were calculated by desorption of pyridine with barely visible peaks in the magnified view of
at 150°C and 450°C, respectively. The difference Figure S5. Notably, it had the lowest Lewis acidity
between T and S corresponds to the content of (S = 0.38 × 10 mol g), suggesting a limited presence
/
-4
L
weak acid sites (W). The concentrations of Lewis of Ru ions on the external surface of RuY-1. 19,45
acid and Brønsted acid sites were calculated using
Equations III and IV. 3.1.6. NH -TPD of adsorbents
3
L (mol/g) = 3.73 × A L (III) Pyridine-FTIR can only detect the external surface
acidity of MY-1 samples. However, the NH molecule is
3
B (mol/g) = 9.90 × A B (IV) smaller than the pyridine molecule and can easily enter
A B
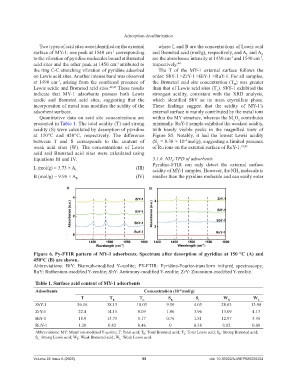
Figure 6. Py-FTIR pattern of MY-1 adsorbents. Spectrum after desorption of pyridine at 150 °C (A) and
450°C (B) are shown.
Abbreviations: BiY: Bismuth-modified Y-zeolite; PY-FTIR: Pyridine-Fourier-transform infrared spectroscopy;
RuY: Ruthenium-modified Y-zeolite; SbY: Antimony-modified Y-zeolite; ZrY: Zirconium-modified Y-zeolite.
Table 1. Surface acid content of MY-1 adsorbents
Adsorbents Concentration (10 mol/g)
‑4
T T B T L S B S L W B W L
SbY-1 56.16 38.13 18.03 9.50 4.05 28.63 13.98
ZrY-1 22.4 14.15 8.09 1.06 3.96 13.09 4.13
BiY-1 18.9 13.73 5.17 0.76 1.81 12.97 3.36
RuY-1 1.28 0.82 0.46 0 0.38 0.82 0.08
Abbreviations: MY: Metal ion-modified Y-zeolite; T: Total acid; T B : Total Brønsted acid; T L : Total Lewis acid; S B : Strong Brønsted acid;
S L : Strong Lewis acid; W B : Weak Brønsted acid; W L : Weak Lewis acid.
Volume 22 Issue 6 (2025) 95 doi: 10.36922/AJWEP025250204