
Page 63 - AJWEP-v22i3
P. 63
Phytochemical and functional traits of Suaeda monoica
by analyzing the nitrogen and phosphorus content in S. monoica growth habitat, roots, and leaves can shed
its roots and leaves. Phosphorus is required for energy light on its nutrient utilization efficiency and adaptations
transmission, cell division, and root development, to saline environments, offering valuable insights into
whereas nitrogen influences protein synthesis and its survival strategies.
photosynthesis – two of the most important processes in
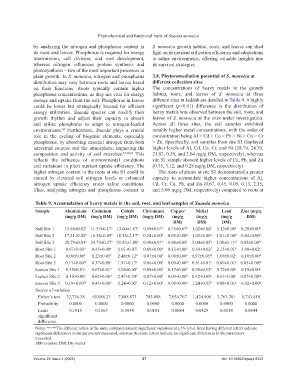
plant growth. In S. monoica, nitrogen and phosphorus 3.8. Phytoremediation potential of S. monoica at
distribution may vary between roots and leaves based different collection sites
on their functions. Roots typically contain higher The concentrations of heavy metals in the growth
phosphorus concentrations, as they are vital for energy habitat, roots, and leaves of S. monoica at three
storage and uptake from the soil. Phosphorus in leaves different sites in Jeddah are detailed in Table 9. A highly
could be lower but strategically located for efficient significant (p<0.01) difference in the distribution of
energy utilization. Suaeda species can modify their heavy metals was observed between the soil, roots, and
growth rhythm and adjust their capacity to absorb leaves of S. monoica at the sites under investigation.
and utilize phosphorus to adapt to nitrogen-loaded Across all three sites, the soil samples exhibited
environments. Furthermore, Suaeda plays a crucial notably higher metal concentrations, with the order of
64
role in the cycling of biogenic elements, especially concentration being Al > Cd > Co > Pb > Ni > Cu > Cr
phosphorus, by absorbing external nitrogen from both > Zn. Specifically, soil samples from site S3 displayed
terrestrial sources and the atmosphere, impacting the higher levels of Al, Cd, Co, Cr, and Ni (28.79, 24.79,
composition and activity of soil microbes. 57,58,65 This 21.83, 0.30, and 2.04 mg/g DM, respectively), whereas
reflects the influence of environmental conditions site S1 sample showed higher levels of Cu, Pb, and Zn
and variations in plant nutrient uptake efficiency. The (0.75, 3.12, and 0.28 mg/g DM, respectively).
higher nitrogen content in the roots at site S1 could be The roots of plants at site S1 demonstrated a greater
caused by elevated soil nitrogen levels or enhanced capacity to accumulate higher concentrations of Al,
nitrogen uptake efficiency under saline conditions. Cd, Cr, Cu, Pb, and Zn (0.67, 0.45, 0.09, 0.13, 2.15,
Thus, analyzing nitrogen and phosphorus content in and 5.00 mg/g DM, respectively) compared to roots at
Table 9. Accumulation of heavy metals in the soil, root, and leaf samples of Suaeda monoica
Sample Aluminium Cadmium Cobalt Chromium Copper Nickel Lead Zinc (mg/g
(mg/g DM) (mg/g DM) (mg/g DM) (mg/g DM) (mg/g (mg/g (mg/g DM)
DM) DM) DM)
Soil Site 1 15.88±0.02 c 11.57±0.17 c 13.00±1.87 c 0.19±0.07 c 0.75±0.07 a 1.02±0.00 c 3.12±0.00 a 0.28±0.00 b
Soil Site 2 17.21±0.02 b 16.54±0.09 b 18.58±2.17 b 0.24±0.00 b 0.05±0.00 g 1.02±0.00 c 1.01±0.00 d 0.04±0.00 e
Soil Site 3 28.79±0.03 a 24.79±0.27 a 21.83±1.08 a 0.30±0.01 a 0.06±0.00 f 2.04±0.05 a 1.08±0.11 cd 0.05±0.00 de
Root Site 1 0.67±0.01 d 0.45±0.00 e 1.01±0.07 f 0.09±0.00 e 0.13±0.00 c 0.54±0.02 f 2.15±0.01 b 5.00±0.02 a
Root Site 2 0.09±0.00 f 0.23±0.05 f 2.48±0.12 d 0.07±0.00 f 0.08±0.00 e 0.57±0.05 ef 1.08±0.02 c 0.10±0.00 d
Root Site 3 0.17±0.00 ef 0.37±0.08 e 1.97±0.17 e 0.06±0.00 f 0.09±0.00 d 0.61±0.01 e 0.09±0.01 g 0.05±0.00 de
Leaves Site 1 0.35±0.01 e 0.67±0.01 d 1.05±0.08 f 0.09±0.00 e 0.17±0.00 b 0.98±0.12 d 0.72±0.00 e 0.19±0.00 c
Leaves Site 2 0.16±0.00 f 0.62±0.00 d 2.47±0.24 d 0.07±0.00 f 0.09±0.00 d 0.42±0.02 g 0.61±0.00 f 0.07±0.00 de
Leaves Site 3 0.19±0.00 ef 0.45±0.06 e 1.24±0.05 f 0.12±0.00 d 0.08±0.00 e 1.24±0.83 b 0.08±0.01 g 0.02±0.00 e
Source of variation
Fisher’s test 32,756.38 65,088.23 7,888.875 785.098 7,054.767 1,424.908 3,763.301 6,743.418
Probability 0.0000 0.0000 0.0000 0.0000 0.0000 0.0000 0.0000 0.0000
Least 0.1915 0.1163 0.3034 0.0101 0.0084 0.0429 0.0514 0.0644
significant
difference
Notes: a,b,c,d,e,f The different letters in the same column represent significant variations at a 5% level. Sites having different letters indicate
significant differences in the parameters measured, whereas the same letters indicate no significant differences in the parameters
measured.
Abbreviation: DM: Dry matter.
Volume 22 Issue 3 (2025) 57 doi: 10.36922/ajwep.8523