
Page 94 - DP-2-1
P. 94
Design+ Analysis of 3D-printed anisotropic cells
usually have 100% material density. By considering the type In the case study, we analyzed the specimen using
of cell and its stress levels, object topology can be optimized a detailed finite element method and compared it with
based on the anisotropic cell type and fabrication parameters. a simplified finite element method featuring linear
orthotropic stiffness cells. In addition, the physical
Statistical analysis was performed using t-tests and
F-tests to determine differences in mean and variance. The specimen was evaluated to assess the accuracy of the
results indicated that hexagonal and grid cells statistically numerical models.
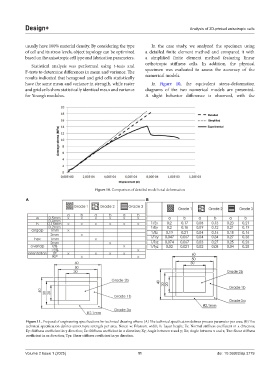
have the same mean and variance in strength, while raster In Figure 10, the equivalent stress-deformation
and grid cells show statistically identical mean and variance diagrams of the two numerical models are presented.
for Young’s modulus. A slight behavior difference is observed, with the
Figure 10. Comparison of detailed model total deformation
A B
Figure 11. Proposal of engineering specifications for technical drawing where: (A) The technical specification defines process parameter per area; (B) The
technical specification defines anisotropic strength per area. Notes: w: Filament width; h: Layer height; Ex: Normal stiffness coefficient in x direction;
Ey: Stiffness coefficient in y direction; Ez: Stiffness coefficient in z direction; Xy; Angle between x and y; Xz; Angle between x and z; Txz: Shear stiffness
coefficient in xz direction; Tyx: Shear stiffness coefficient in yx direction.
Volume 2 Issue 1 (2025) 11 doi: 10.36922/dp.3779