
Page 92 - DP-2-1
P. 92
Design+ Analysis of 3D-printed anisotropic cells
A B
C
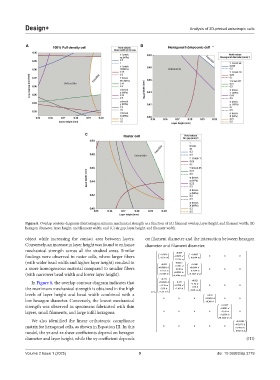
Figure 8. Overlap contour diagrams illustrating maximum mechanical strength as a function of (A) filament overlap, layer height, and filament width; (B)
hexagon diameter, layer height, and filament width; and (C) air gap, layer height, and filament width.
object while increasing the contact area between layers. on filament diameter and the interaction between hexagon
Conversely, an increase in layer height was found to enhance diameter and filament diameter.
mechanical strength across all the studied areas. Similar + 0.069
findings were observed in raster cells, where larger fibers − + 0.195⋅ 0.2816 w − 0.0279⋅ d − − 0.0594⋅ + 0.0695 w 0 0 0
(with wider bead width and higher layer height) resulted in + 0.052 0.1166⋅ + 0.5213 w + 0.1681
a more homogeneous material compared to smaller fibers 0.02884⋅ 0.1152⋅ w d − + − 0.1907⋅ 0.818⋅ w d − + 0.2634⋅ 0.0699⋅d w − 0 0 0
(with narrower bead width and lower layer height). 0.1305⋅ h + + 0.2244⋅ wd h + + 0.1368⋅⋅ wd
+ 0.513 0.4206⋅⋅
In Figure 8, the overlap contour diagram indicates that + 0.02688⋅ 1.135⋅ d − − w 0.1740⋅ − 0.271 d − + 1.91⋅ 0.923 w 0 0 0
the maximum mechanical strength is obtained in the high − 6.26⋅⋅ 2.58⋅ h 1.301⋅ h + + 12.03⋅⋅ 4.38⋅ wh −
h
levels of layer height and bead width combined with a [ ] = C wh + − 0.0531
low hexagon diameter. Conversely, the lowest mechanical 0 0 0 − 0.03435⋅ + 0.369⋅ d 0 0 h
strength was observed in specimens fabricated with thin − + 0.0903⋅ 0.1237 d
layers, small filaments, and large infill hexagons. 0 0 0 0 0.149⋅ w − 0
h
+ 0.2558⋅ wd +
We also identified the linear orthotropic compliance 0.1622⋅⋅ − 0.01584
d
matrix for hexagonal cells, as shown in Equation III. In this 0 0 0 0 0 − 0.01557⋅ 0.1466⋅ h +
model, the yz and xz shear coefficients depend on hexagon − 0.523⋅⋅ hd
diameter and layer height, while the xy coefficient depends (III)
Volume 2 Issue 1 (2025) 9 doi: 10.36922/dp.3779