
Page 89 - DP-2-1
P. 89
Design+ Analysis of 3D-printed anisotropic cells
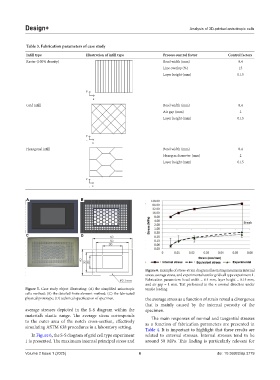
Table 3. Fabrication parameters of case study
Infill type Illustration of infill type Process control factor Control factors
Raster (100% density) Bead width (mm) 0.4
Line overlap (%) 15
Layer height (mm) 0.15
Grid infill Bead width (mm) 0.4
Air gap (mm) 2
Layer height (mm) 0.15
Hexagonal infill Bead width (mm) 0.4
Hexagon diameter (mm) 2
Layer height (mm) 0.15
A B
C D
Figure 6. Example of stress-strain diagram illustrating maximum internal
stress, average stress, and experimental test for grid cell type experiment 1.
Fabrication parameters: bead width = 0.4 mm, layer height = 0.15 mm,
and air gap = 1 mm. Test performed in the × normal direction under
Figure 5. Case study object illustrating: (A) the simplified anisotropic tensile loading.
cells method; (B) the detailed finite element method; (C) the fabricated
physical prototype; (D) technical specification of specimen. the average stress as a function of strain reveal a divergence
that is mainly caused by the internal porosity of the
average stresses depicted in the S-S diagram within the specimen.
material’s elastic range. The average stress corresponds The main responses of normal and tangential stresses
to the outer area of the notch cross-section, effectively as a function of fabrication parameters are presented in
simulating ASTM 638 procedures in a laboratory setting.
Table 4. It is important to highlight that these results are
In Figure 6, the S-S diagram of grid cell type experiment related to external stresses. Internal stresses tend to be
1 is presented. The maximum internal principal stress and around 50 MPa. This finding is particularly relevant for
Volume 2 Issue 1 (2025) 6 doi: 10.36922/dp.3779