
Page 90 - DP-2-1
P. 90
Design+ Analysis of 3D-printed anisotropic cells
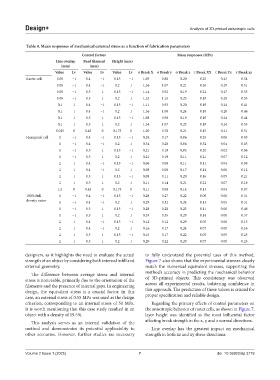
Table 4. Mean responses of mechanical external stress as a function of fabrication parameters
Control factors Mean responses (MPa)
Line overlap Bead filament Height (mm)
(mm) (mm)
Value Lv Value Lv Value Lv σ Break X σ Break y σ Break z τ Break XY τ Break Yz τ Break xz
Raster cell 0.05 −1 0.4 −1 0.15 −1 1.09 0.88 0.20 0.25 0.23 0.54
0.05 −1 0.4 −1 0.2 1 1.36 1.07 0.21 0.26 0.29 0.51
0.05 −1 0.5 1 0.15 −1 1.14 0.92 0.19 0.22 0.27 0.55
0.05 −1 0.5 1 0.2 1 1.32 1.15 0.25 0.19 0.28 0.53
0.1 1 0.4 −1 0.15 −1 1.11 0.93 0.20 0.19 0.24 0.41
0.1 1 0.4 −1 0.2 1 1.36 1.00 0.24 0.18 0.28 0.46
0.1 1 0.5 1 0.15 −1 1.08 0.90 0.19 0.19 0.24 0.44
0.1 1 0.5 1 0.2 1 1.34 1.07 0.23 0.19 0.24 0.55
0.025 0 0.45 0 0.175 0 1.20 0.78 0.21 0.15 0.21 0.51
Hexagonal cell 1 −1 0.4 −1 0.15 −1 0.24 0.17 0.06 0.25 0.06 0.05
1 −1 0.4 −1 0.2 1 0.34 0.20 0.06 0.32 0.04 0.05
1 −1 0.5 1 0.15 −1 0.21 0.19 0.05 0.20 0.02 0.06
1 −1 0.5 1 0.2 1 0.21 0.19 0.11 0.21 0.07 0.12
2 1 0.4 −1 0.15 −1 0.06 0.08 0.11 0.11 0.04 0.08
2 1 0.4 −1 0.2 1 0.08 0.08 0.17 0.14 0.06 0.12
2 1 0.5 1 0.15 −1 0.08 0.11 0.20 0.16 0.09 0.21
2 1 0.5 1 0.2 1 0.11 0.14 0.21 0.22 0.07 0.18
1.5 0 0.45 0 0.175 0 0.11 0.08 0.14 0.13 0.04 0.07
100% Full 1 −1 0.4 −1 0.15 −1 0.28 0.27 0.22 0.09 0.06 0.31
density raster 1 −1 0.4 −1 0.2 1 0.29 0.32 0.24 0.13 0.05 0.31
1 −1 0.5 1 0.15 −1 0.28 0.28 0.23 0.11 0.06 0.46
1 −1 0.5 1 0.2 1 0.39 0.35 0.29 0.14 0.08 0.37
2 1 0.4 −1 0.15 −1 0.12 0.12 0.29 0.05 0.06 0.15
2 1 0.4 −1 0.2 1 0.16 0.17 0.24 0.07 0.08 0.16
2 1 0.5 1 0.15 −1 0.15 0.17 0.22 0.05 0.09 0.25
2 1 0.5 1 0.2 1 0.20 0.22 0.29 0.07 0.08 0.25
designers, as it highlights the need to evaluate the actual to fully understand the potential uses of this method.
strength of an object by considering both internal infill and Figure 7 also shows that the experimental stresses closely
external geometry. match the numerical equivalent stresses, supporting the
The difference between average stress and internal method’s accuracy in predicting the mechanical behavior
stress is noticeable, primarily due to the orientation of the of 3D-printed objects. This consistency was observed
filaments and the presence of internal gaps. In engineering across all experimental results, bolstering confidence in
design, the equivalent stress is a crucial factor. In this this approach. The prediction of these values is crucial for
case, an external stress of 0.55 MPa was used as the design proper specification and reliable design.
criterion, corresponding to an internal stress of 50 MPa. Regarding the primary effects of control parameters on
It is worth mentioning that this case study resulted in an the anisotropic behavior of raster cells, as shown in Figure 7,
object with a density of 19.5%. layer height was identified as the most influential factor
This analysis serves as an internal validation of the affecting break strength in the x, y, and z normal directions.
method and demonstrates its potential applicability to Line overlap has the greatest impact on mechanical
other scenarios. However, further studies are necessary strength in both xz and xy shear directions.
Volume 2 Issue 1 (2025) 7 doi: 10.36922/dp.3779