
Page 93 - DP-2-1
P. 93
Design+ Analysis of 3D-printed anisotropic cells
The typical coefficients were largely influenced by the + 0.869 + 0.0923 + 0.0402
diameters of the hexagon and the filament, with the layer + 0.741 Hd Wd⋅ − − 0.339 Hd⋅ 1.646 Wd⋅ ⋅ 0.0903 Hd Wd⋅ − − 0.0429 Hd⋅ 0.143 Wd⋅ ⋅ + − 0.02786 Hd ⋅ 0.103 Wd⋅ 0 0 0
height impacting the Poisson ratios and strength in the z + 0.0536 + + 0.0584 0.06676 Hd
−
0.1616
⋅
+
⋅
direction. − − 0.216 Hd − − 0.0289 Hd + 0.1408 Wd⋅ ⋅ 0 0 0
⋅
0.1139 Wd⋅
1.036 Wd
+ 0.547 Hd Wd ⋅ ⋅ + 0.0727 Hd Wd⋅ ⋅ + 0.0297 h⋅
− 0.008
The final cell type examined was the grid cell. In this 0.06676 Hd + − 0.1616 ⋅ − 0.00323 Hd − 0.0911 Hd + 0.2792
⋅
⋅
0.372 h ⋅
cell type, the infill filaments are completely separated by air + + 0.1408 Wd 0.263 Hd Wd − + 0.265 Wd + 0.352 Wd⋅ 0 0 0
⋅
⋅
+
0.528 h⋅
0.0297 h ⋅
gaps, with their orientation shifts by 90° in each successive [C] = + ⋅ ⋅ − 0.278
layer. 0 0 0 + 0.1616 Hd + 1.195 h ⋅ ⋅ 0 0
− 0.278
The air gap was identified as the control factor most 0 0 0 0 + 0.1616 Hd + 1.195 h ⋅ ⋅ 0
detrimental to overall mechanical strength, while layer + 0.239
height was found to improve mechanical strength in all 0 0 0 0 0 − 0.0642 Hd − 0.552 Wd⋅ ⋅
aspects except for the xz shear break, as presented in + 0.237 Hd Wd⋅ ⋅
Figure 7. Importantly, bead width was also observed (IV)
to increase the mechanical strength in all dimensions,
supporting the hypothesis that objects fabricated with In this model, almost all normal coefficients were found
larger bead filaments are tougher than small bead to depend on air gap, filament diameter and layer height.
In contrast, the normal coefficients in the x direction were
filaments.
primarily influenced by the air gap.
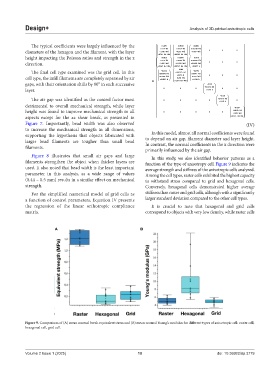
Figure 8 illustrates that small air gaps and large In this study, we also identified behavior patterns as a
filaments strengthen the object when thicker layers are function of the type of anisotropy cell. Figure 9 indicates the
used. It also noted that bead width is the least important average strength and stiffness of the anisotropic cells analyzed.
parameter in this analysis, as a wide range of values Among the cell types, raster cells exhibited the highest capacity
(0.44 – 0.5 mm) results in a similar effect on mechanical to withstand stress compared to grid and hexagonal cells.
strength. Conversely, hexagonal cells demonstrated higher average
For the simplified numerical model of grid cells as stiffness than raster and grid cells, although with a significantly
a function of control parameters, Equation IV presents larger standard deviation compared to the other cell types.
the regression of the linear orthotropic compliance It is crucial to note that hexagonal and grid cells
matrix. correspond to objects with very low density, while raster cells
A B
Figure 9. Comparison of (A) mean normal break equivalent stress and (B) mean normal Young’s modulus for different types of anisotropic cell: raster cell,
hexagonal cell, grid cell.
Volume 2 Issue 1 (2025) 10 doi: 10.36922/dp.3779