
Page 167 - EJMO-9-2
P. 167
Eurasian Journal of
Medicine and Oncology Genetic insights into CAD drug targets
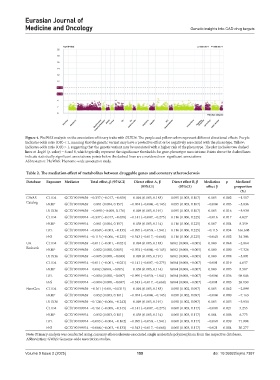
Figure 4. PheWAS analysis on the association of binary traits with DHX36. The purple and yellow colors represent different directional effects. Purple:
Indicates odds ratio (OR) < 1, meaning that the genetic variant may have a protective effect or be negatively associated with the phenotype. Yellow:
Indicates odds ratio (OR) > 1, suggesting that the genetic variant may be associated with a higher risk of the phenotype. The plot includes two dashed
lines at -log10 (p-value) = 6 and 8, which typically represent the significance thresholds for gene-phenotype associations: Points above the dashed lines
indicate statistically significant associations; points below the dashed lines are considered non-significant associations.
Abbreviation: PheWAS: Phenome-wide association study.
Table 2. The mediation effect of metabolites between druggable genes and coronary atherosclerosis
Database Exposure Mediator Total effect, β (95%CI) Direct effect A, β Direct effect B, β Mediation p Mediated
(95%CI) (95%CI) effect β proportion
(%)
GWAS CHD4 GCST90199639 −0.337 (−0.017, −0.658) 0.094 (0.005, 0.183) 0.055 (0.003, 0.107) 0.005 0.082 −1.517
Catalog FKRP GCST90199639 0.081 (0.004, 0.157) −0.074 (−0.004, −0.145) 0.055 (0.003, 0.107) −0.004 0.003 −5.036
DHX36 GCST90199639 −0.090 (−0.005, 0.176) 0.098 (0.005, 0.191) 0.055 (0.003, 0.107) 0.005 0.016 −5.938
CHD4 GCST90199914 −0.337 (−0.017, −0.658) −0.141 (−0.007, −0.275) 0.116 (0.006, 0.225) −0.016 0.017 4.827
FKRP GCST90199914 0.081 (0.004, 0.157) 0.058 (0.003, 0.114) 0.116 (0.006, 0.225) 0.007 0.004 8.359
LPL GCST90199914 −0.069 (−0.003, −0.135) −0.995 (−0.050, −1.941) 0.116 (0.006, 0.225) −0.115 0.034 166.608
FES GCST90199914 −0.115 (−0.006, −0.225) −0.343 (−0.017, −0.668) 0.116 (0.006 ,0.225) −0.040 0.002 34.386
UK CHD4 GCST90199639 −0.011 (−0.001, −0.021) 0.094 (0.005, 0.183) 0.002 (0.000, −0.005) 0.000 0.068 −2.064
Biobank FKRP GCST90199639 0.002 (0.000, 0.005) −0.074 (−0.004, −0.145) 0.002 (0.000, −0.005) 0.000 0.000 −7.326
DHX36 GCST90199639 −0.005 (0.000, −0.009) 0.098 (0.005, 0.191) 0.002 (0.000, −0.005) 0.000 0.008 −5.001
CHD4 GCST90199914 −0.011 (−0.001, −0.021) −0.141 (−0.007, −0.275) 0.004 (0.000, −0.007) −0.001 0.019 4.637
FKRP GCST90199914 0.002 (0.000, −0.005) 0.058 (0.003, 0.114) 0.004 (0.000, −0.007) 0.000 0.005 8.587
LPL GCST90199914 −0.004 (0.000, −0.007) −0.995 (−0.050, −1.941) 0.004 (0.000, −0.007) −0.004 0.036 98.846
FES GCST90199914 −0.004 (0.000, −0.007) −0.343 (−0.017, −0.668) 0.004 (0.000, −0.007) −0.001 0.003 28.130
FinnGen CHD4 GCST90199639 −0.161 (-0.08, −0.0315) 0.094 (0.005, 0.183) 0.050 (0.002, 0.097) 0.005 0.062 −2.899
FKRP GCST90199639 0.052 (0.003, 0.101) −0.074 (−0.004, −0.145) 0.050 (0.002, 0.097) −0.004 0.000 −7.163
DHX36 GCST90199639 −0.124 (−0.006, −0.242) 0.098 (0.005, 0.191) 0.050 (0.002, 0.097) 0.005 0.005 −3.950
CHD4 GCST90199914 −0.161 (−0.008, −0.315) −0.141 (−0.007, −0.275) 0.060 (0.003, 0.117) −0.008 0.021 5.255
FKRP GCST90199914 0.052 (0.003, 0.101) 0.058 (0.003, 0.114) 0.060 (0.003, 0.117) 0.004 0.006 6.773
LPL GCST90199914 −0.083 (−0.004, −0.162) −0.995 (−0.050, −1.941) 0.060 (0.003, 0.117) −0.060 0.039 71.998
FES GCST90199914 −0.068 (−0.003, −0.133) −0.343 (−0.017, −0.668) 0.060 (0.003, 0.117) −0.021 0.004 30.277
Note: Primary analysis was conducted using coronary atherosclerosis-associated single nucleotide polymorphism from the respective databases.
Abbreviation: GWAS: Genome-wide association studies.
Volume 9 Issue 2 (2025) 159 doi: 10.36922/ejmo.7387