
Page 68 - ESAM-1-4
P. 68
Engineering Science in
Additive Manufacturing EST manipulates structure of Ti-6Al-4V/Cu
A B
C D
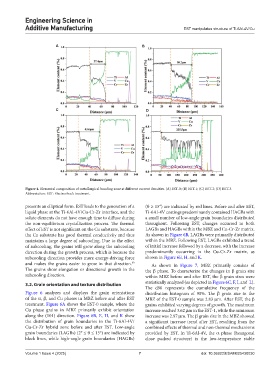
Figure 4. Elemental composition of metallurgical bonding zone at different current densities. (A) EST-0; (B) EST-1; (C) EST-2; (D) EST-3.
Abbreviation: EST: Electroshock treatment.
presents an elliptical form. EST leads to the generation of a (θ ≥ 15°) are indicated by red lines. Before and after EST,
liquid phase at the Ti-6Al-4V/Cu-Cr-Zr interface, and the Ti-6Al-4V coatings predominantly contained HAGBs with
solute elements do not have enough time to diffuse during a small number of low-angle grain boundaries distributed
the non-equilibrium crystallization process. The thermal throughout. Following EST, changes occurred in both
effect of EST is not significant on the Cu substrate, because LAGBs and HAGBs within the MBZ and Cu-Cr-Zr matrix.
the Cu substrate has good thermal conductivity and thus As shown in Figure 6B, LAGBs were primarily distributed
maintains a large degree of subcooling. Due to the effect within the MBZ. Following EST, LAGBs exhibited a trend
of subcooling, the grains will grow along the subcooling of initial increase followed by a decrease, with the increase
direction during the growth process, which is because the predominantly occurring in the Cu-Cr-Zr matrix, as
subcooling direction provides more energy-driving force shown in Figure 6E, H, and K.
and makes the grains easier to grow in that direction. As shown in Figure 7, MBZ primarily consists of
39
The grains show elongation or directional growth in the the β phase. To characterize the changes in β grain size
subcooling direction. within MBZ before and after EST, the β grain sizes were
3.2. Grain orientation and texture distribution statistically analyzed (as depicted in Figure 6C, F, I, and L).
The d90 represents the cumulative frequency of the
Figure 6 analyzes and displays the grain orientations distribution histogram of 90%. The β grain size in the
of the α, β, and Cu phases in MBZ before and after EST MBZ of the EST-0 sample was 2.83 μm. After EST, the β
treatment. Figure 6A shows the EST-0 sample, where the grains exhibited varying degrees of growth. The maximum
Cu phase grains in MBZ primarily exhibit orientation increase reached 3.62 μm in the EST-1, while the minimum
along the (101) direction. Figure 6B, E, H, and K show increase was 2.97 μm. The β grain size in the MBZ showed
the distribution of grain boundaries in the Ti-6Al-4V/ a significant increase trend after EST, resulting from the
Cu-Cr-Zr hybrid zone before and after EST. Low-angle combined effects of thermal and non-thermal mechanisms
grain boundaries (LAGBs) (2° ≤ θ ≤ 15°) are indicated by provided by EST. In Ti-6Al-4V, the α phase (hexagonal
black lines, while high-angle grain boundaries (HAGBs) close packed structure) is the low-temperature stable
Volume 1 Issue 4 (2025) 7 doi: 10.36922/ESAM025430030