
Page 86 - GPD-2-1
P. 86
Gene & Protein in Disease A pan-cancer analysis of HMGB1
A C
B
D
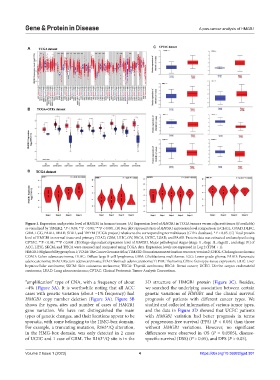
Figure 1. Expression and protein level of HMGB1 in human tumors. (A) Expression level of HMGB1 in TCGA tumors versus adjacent tissues (if available)
as visualized by TIMER2. *P < 0.05; **P < 0.01; ***P < 0.001. (B) Box plot representation of HMGB1 expression level comparison in CHOL, COAD, DLBC,
GBM, LGG, PAAD, READ, STAD, and THYM (TCGA project) relative to the corresponding normal tissues (GTEx database). *P < 0.05. (C) Total protein
level of HMGB1 in normal tissue and primary COAD, GBM, LIHC, OV, BRCA, UCEC, LUAD, and PAAD. Protein data was extracted and analyzed using
CPTAC. **P < 0.01; ***P < 0.001. (D) Stage-dependent expression level of HMGB1. Major pathological stages (stage Ⅰ, stage Ⅱ, stageⅢ , and stage Ⅳ) of
ACC, LIHC, SKCM, and THCA were assessed and compared using TCGA data. Expression levels are expressed in Log 2 (TPM + 1).
HMGB1: High mobility group box 1; TCGA: The Cancer Genome Atlas; TIMER2: Tumor immune estimation resource, version 2; CHOL: Cholangiocarcinoma;
COAD: Colon adenocarcinoma; DLBC: Diffuse large B-cell lymphoma; GBM: Glioblastoma multiforme; LGG: Lower grade glioma; PAAD: Pancreatic
adenocarcinoma; READ: Rectum adenocarcinoma; STAD: Stomach adenocarcinoma; THYM: Thymoma; GTEx: Genotype-tissue expression; LIHC: Liver
hepatocellular carcinoma; SKCM: Skin cutaneous melanoma; THCA: Thyroid carcinoma; BRCA: Breast cancer; UCEC: Uterine corpus endometrial
carcinoma; LUAD: Lung adenocarcinoma; CPTAC: Clinical Proteomic Tumor Analysis Consortium.
“amplification” type of CNA, with a frequency of about 3D structure of HMGB1 protein (Figure 3C). Besides,
~4% (Figure 3A). It is worthwhile noting that all ACC we searched the underlying association between certain
cases with genetic variation (about ~1% frequency) had genetic variations of HMGB1 and the clinical survival
HMGB1 copy number deletion (Figure 3A). Figure 3B prognosis of patients with different cancer types. We
shows the types, sites and number of cases of HMGB1 studied and collected information of various tumor types,
gene variation. We have not distinguished the main and the data in Figure 3D showed that UCEC patients
types of genetic changes, and their locations appear to be with HMGB1 variation had better prognosis in terms
sporadic, with some belonging to the HMG-box domain. of progression-free survival (PFS) (P < 0.05) than those
For example, a truncating mutation, R163*/Q alteration, without HMGB1 variations. However, no significant
in the HMG-box domain, was only detected in 2 cases differences were observed in OS (P = 0.0505), disease-
of UCEC and 1 case of GBM. The R163*/Q site is in the specific survival (DSS) (P > 0.05), and DFS (P > 0.05).
Volume 2 Issue 1 (2023) 4 https://doi.org/10.36922/gpd.301