
Page 87 - GPD-2-1
P. 87
Gene & Protein in Disease A pan-cancer analysis of HMGB1
A
B
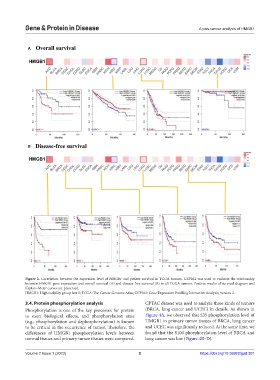
Figure 2. Correlation between the expression level of HMGB1 and patient survival in TCGA tumors. GEPIA2 was used to evaluate the relationship
between HMGB1 gene expression and overall survival (A) and disease-free survival (B) in all TCGA tumors. Positive results of survival diagram and
Kaplan–Meier curves are presented.
HMGB1: High mobility group box 1; TCGA: The Cancer Genome Atlas; GEPIA2: Gene Expression Profiling Interactive Analysis, version 2.
3.4. Protein phosphorylation analysis CPTAC dataset was used to analyze three kinds of tumors
Phosphorylation is one of the key processes for protein (BRCA, lung cancer and UCEC) in details. As shown in
to exert biological effects, and phosphorylation state Figure 4A, we observed that S35 phosphorylation level of
(e.g., phosphorylation and dephosphorylation) is known HMGB1 in primary tumor tissues of BRCA, lung cancer
to be critical in the occurrence of tumor. Therefore, the and UCEC was significantly reduced. At the same time, we
differences of HMGB1 phosphorylation levels between found that the S100 phosphorylation level of BRCA and
normal tissues and primary tumor tissues were compared. lung cancer was low (Figure 4B–D).
Volume 2 Issue 1 (2023) 5 https://doi.org/10.36922/gpd.301