
Page 90 - GPD-2-1
P. 90
Gene & Protein in Disease A pan-cancer analysis of HMGB1
A
B
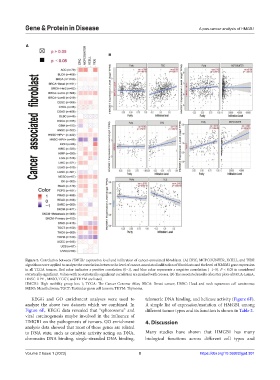
Figure 5. Correlation between HMGB1 expression level and infiltration of cancer-associated fibroblasts. (A) EPIC, MCPCOUNTER, XCELL, and TIDE
algorithms were applied to analyze the correlation between the level of cancer-associated infiltration of fibroblasts and the level of HMGB1 gene expression
in all TCGA tumors. Red color indicates a positive correlation (0–1), and blue color represents a negative correlation (−1–0). P < 0.05 is considered
statistically significant. Values with no statistically significant correlation are marked with crosses. (B) The associated results of scatter plots of BRCA-LumA,
HNSC-HPV-, MESO, TGCT, and THYM are listed.
HMGB1: High mobility group box 1; TCGA: The Cancer Genome Atlas; BRCA: Breast cancer; HNSC: Head and neck squamous cell carcinoma;
MESO: Mesothelioma; TGCT: Testicular germ cell tumors; THYM: Thymoma.
KEGG and GO enrichment analyses were used to telomeric DNA binding, and helicase activity (Figure 6F).
analyze the above two datasets which we combined. In A simple list of expression/mutation of HMGB1 among
Figure 6E, KEGG data revealed that “spliceosome” and different tumor types and its function is shown in Table 2.
viral carcinogenesis maybe involved in the influence of
HMGB1 on the pathogenesis of tumors. GO enrichment 4. Discussion
analysis data showed that most of these genes are related
to DNA state, such as catalytic activity acting on DNA, Many studies have shown that HMGB1 has many
chromatin DNA binding, single-stranded DNA binding, biological functions across different cell types and
Volume 2 Issue 1 (2023) 8 https://doi.org/10.36922/gpd.301