
Page 289 - IJB-10-1
P. 289
International Journal of Bioprinting Scaffolds manufacturing by fused deposition modeling
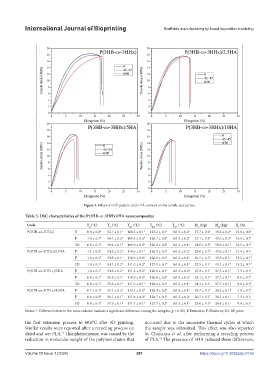
Figure 3. Effect of infill pattern and nHA content on the tensile test curves.
Table 3. DSC characteristics of the P(3HB-co-3HHx)/HA nanocomposites
Code T (°C) T (°C) T (°C) T (°C) T (°C) H (J/g) H (J/g) X (%)
m1
g
cc
cc
m
c
m2
m3
P(3HB-co-3HHx) E 0.8 ± 0.2 a 52.1 ± 0.1 a 108.5 ± 0.1 a 125.2 ± 0.1 a 161.3 ± 0.2 a 27.7 ± 0.2 a 49.6 ± 0.2 a 15.0 ± 0.2 a
F 1.0 ± 0.1 b 50.1 ± 0.2 a 109.5 ± 0.3 a 126.7 ± 0.2 a 161.5 ± 0.2 a 27.1 ± 0.3 a 49.5 ± 0.3 a 15.3 ± 0.1 a
3D 0.8 ± 0.1 b 49.6 ± 0.1 b 109.9 ± 0.2 a 126.5 ± 0.2 a 161.4 ± 0.1 a 24.0 ± 0.3 b 50.9 ± 0.1 a 18.5 ± 0.1 b
P(3HB-co-3HHx)/2.5HA E 1.1 ± 0.2 c 54.3 ± 0.2 a 110.6 ± 0.1 a 126.9 ± 0.1 a 161.6 ± 0.2 a 28.0 ± 0.1 b 45.0 ± 0.1 b 11.9 ± 0.1 c
F 1.0 ± 0.1 d 54.3 ± 0.1 a 110.9 ± 0.3 a 126.9 ± 0.1 a 161.6 ± 0.1 a 26.7 ± 0.1 b 45.5 ± 0.1 c 13.2 ± 0.1 d
3D 1.0 ± 0.1 e 54.1 ± 0.2 a 111.0 ± 0.3 a 127.1 ± 0.1 a 161.8 ± 0.1 a 23.5 ± 0.1 c 45.1 ± 0.1 d 15.2 ± 0.1 d
P(3HB-co-3HH x)/5HA E 1.0 ± 0.1 f 54.3 ± 0.2 a 111.2 ± 0.3 a 126.6 ± 0.1 a 161.9 ± 0.2 a 27.2 ± 0.1 c 37.3 ± 0.1 e 7.3 ± 0.1 e
F 0.8 ± 0.1 f 55.5 ± 0.1 c 110.9 ± 0.2 a 126.8 ± 0.2 a 161.3 ± 0.2 a 25.1 ± 0.1 d 37.3 ± 0.1 f 8.8 ± 0.1 f
3D 0.8 ± 0.1 f 55.6 ± 0.1 d 111.0 ± 0.1 a 128.6 ± 0.1 a 161.5 ± 0.1 a 24.4 ± 0.1 e 37.7 ± 0.1 g 9.6 ± 0.1 g
P(3HB-co-3HH x)/10HA E 0.7 ± 0.1 g 57.1 ± 0.2 e 112.1 ± 0.2 a 128.4 ± 0.2 a 161.8 ± 0.1 a 29.7 ± 0.1 f 36.2 ± 0.1 h 4.9 ± 0.1 h
F 0.6 ± 0.2 h 58.1 ± 0.1 f 111.6 ± 0.2 a 128.7 ± 0.1 a 161.2 ± 0.2 a 26.7 ± 0.1 f 36.3 ± 0.1 i 7.3 ± 0.1 i
3D 0.8 ± 0.1 h 57.9 ± 0.1 g 111.7 ± 0.1 a 127.7 ± 0.2 a 161.3 ± 0.1 a 25.0 ± 0.1 g 36.9 ± 0.1 j 9.0 ± 0.1 j
Notes: Different letters in the same column indicate a significant difference among the samples (p < 0.05). E Extrusion; F, Filament; 3D, 3D print.
a–j
the first extrusion process to 49.6°C after 3D printing. occurred due to the successive thermal cycles at which
Similar results were reported after a recycling process on the sample was submitted. This effect was also reported
dried and wet PLA. This phenomenon was caused by the by Chaitanya et al. after performing a recycling process
72
reduction in molecular weight of the polymer chains that of PLA. The presence of nHA reduced these differences,
73
Volume 10 Issue 1 (2024) 281 https://doi.org/10.36922/ijb.0156