
Page 290 - IJB-10-1
P. 290
International Journal of Bioprinting Scaffolds manufacturing by fused deposition modeling
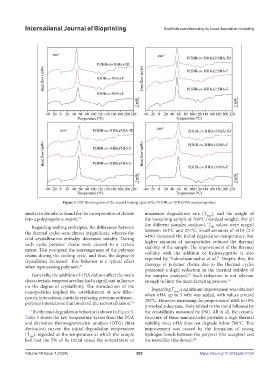
Figure 4. DSC thermograms of the second heating cycle of the P(3HB-co-3HHx)/HA nanocomposites.
similar to the effects found for the incorporation of cloisite maximum degradation rate (T max ), and the weight of
into a polypropylene matrix. 74 the remaining sample at 700°C (residual weight). For all
Regarding melting enthalpies, the differences between the different samples analyzed, T values were ranged
5%
the thermal cycles were almost insignificant, whereas the between 261°C and 271°C. Small amounts of nHA (2.5
cold crystallization enthalpy decreased notably. During wt%) increased the initial degradation temperature, but
each cycle, polymer chains were cleaved to a certain higher amounts of nanoparticles reduced the thermal
extent. This prompted the rearrangement of the polymer stability of the sample. The improvement of the thermal
chains during the cooling cycle, and thus, the degree of stability with the addition of hydroxyapatite is also
77
crystallinity increased. This behavior is a typical effect reported by Trakoolwannachai et al. Despite this, the
when reprocessing polymers. 75 cleavage of polymer chains due to the thermal cycles
promoted a slight reduction in the thermal stability of
Generally, the addition of nHA did not affect the main the samples analyzed. Such reduction is not relevant
78
characteristic temperatures but had a significant influence enough to limit the manufacturing process. 79
on the degree of crystallinity. The introduction of the Regarding T , a significant improvement was obtained
nanoparticles implied the establishment of new filler– when nHA up to 5 wt% was added, with values around
max
matrix interactions, partially replacing previous polymer– 292°C. However, increasing the proportion of nHA to 10%
polymer interactions that hindered the recrystallization. 76
provoked a decrease, likely related to the trend followed by
The thermal degradation behavior is shown in Figure 5. the crystallinity measured by DSC. All in all, the ceramic
Table 4 shows the key temperature values from the TGA structure of these nanoparticles provides a high thermal
and derivative thermogravimetric analysis (DTG) (first stability, since nHA does not degrade below 700°C. This
derivative) curves: the initial degradation temperature improvement was caused by the formation of strong
(T ), regarded as the temperature at which the sample hydrogen bonds between the polymer (the acceptor) and
5%
had lost the 5% of its initial mass; the temperature of the nanofiller (the donor). 80
Volume 10 Issue 1 (2024) 282 https://doi.org/10.36922/ijb.0156