
Page 433 - IJB-10-1
P. 433
International Journal of Bioprinting Mechanically biomimicking 3D bone model
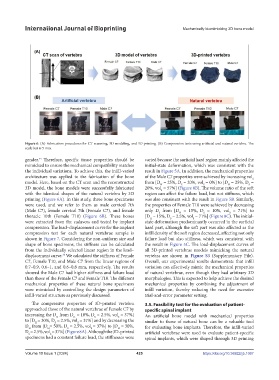
Figure 6. (A) Fabrication procedures for CT scanning, 3D modeling, and 3D printing. (B) Compression tests using artificial and natural vertebra. The
scale bar is 5 mm.
44
gender. Therefore, specific tissue properties should be varied because the surficial hard region mainly affected the
mimicked to ensure the mechanical compatibility matches initial-state deformation, which was consistent with the
the individual variations. To achieve this, the infill-varied result in Figure 5A. In addition, the mechanical properties
architecture was applied to the fabrication of the bone of the Male C7 properties were achieved by increasing vol
S
model. Here, based on the CT scan and the reconstructed from [D = 25%, D = 20%, vol = 0%] to [D = 25%, D =
S
S
S
H
H
3D model, the bone models were successfully fabricated 20%, vol = 57%] (Figure 8B). The volume ratio of the soft
S
with the identical shapes of the natural vertebra by 3D region can affect the failure load, but not stiffness, which
printing (Figure 6A). In this study, three bone specimens was also consistent with the result in Figure 5B. Similarly,
were used, and we refer to them as male cervical 7th the properties of Female T10 were achieved by decreasing
(Male C7), female cervical 7th (Female C7), and female only D from [D = 15%, D = 10%, vol = 71%] to
S
S
S
H
thoracic 10th (Female T10) (Figure 6B). These bones [D = 15%, D = 2.5%, vol = 71%] (Figure 8C). The initial-
S
S
H
were extracted from the cadavers and tested by implant state deformation predominantly occurred in the surficial
compression. The load–displacement curve for the implant hard part, although the soft part was also affected as the
compression test for each natural vertebrae sample is infill density of the soft region decreased, affecting not only
shown in Figure 7. Considering the non-uniform size and failure load but also stiffness, which was consistent with
shape of bone specimens, the stiffness can be calculated the result in Figure 5C. The load-displacement curves of
from the individually selected linear region in the load– all 3D-printed vertebrae models mimicking the natural
displacement curve. We calculated the stiffness of Female vertebra are shown in Figure S3 (Supplementary File).
38
C7, Female T10, and Male C7 from the linear regions of Overall, our experimental results demonstrate that infill
0.7–0.9, 0.6–1, and 0.6–0.8 mm, respectively. The results variation can effectively mimic the mechanical properties
showed the Male C7 had higher stiffness and failure load of natural vertebrae, even though they had arbitrary 3D
than those of the Female C7 and Female T10. The different morphologies. This is expected to help achieve the desired
mechanical properties of these natural bone specimens mechanical properties by combining the adjustment of
were mimicked by controlling the design parameters of infill variation, thereby reducing the need for excessive
infill-varied structure as previously discussed. trial-and-error parameter setting.
The compressive properties of 3D-printed vertebra 3.5. Feasibility test for the evaluation of patient-
approached those of the natural vertebrae of Female C7 by specific spinal implant
increasing the D from D = 10%, D = 2.5%, vol = 37%] An artificial bone model with mechanical properties
S
S
H
H
to [D = 30%, D = 2.5%, vol = 37%] and by decreasing the similar to those of natural bone can be a valuable tool
S
H
S
D from [D = 50%, D = 2.5%, vol = 37%] to [D = 30%, for evaluating bone implants. Therefore, the infill-varied
H
H
S
H
S
D = 2.5%, vol = 37%] (Figure 8A). Although the 3D-printed artificial vertebrae were used to evaluate patient-specific
S
S
specimens had a constant failure load, the stiffnesses were spinal implants, which were shaped through 3D printing
Volume 10 Issue 1 (2024) 425 https://doi.org/10.36922/ijb.1067