
Page 445 - IJB-10-1
P. 445
International Journal of Bioprinting Bioactive scaffold for necrosis bone repair
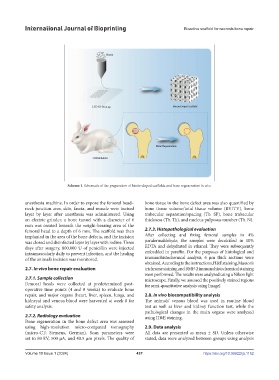
Scheme 1. Schematic of the preparation of biotin-doped scaffolds and bone regeneration in vivo.
anesthesia machine. In order to expose the femoral head– bone tissue in the bone defect area was also quantified by
neck junction area, skin, fascia, and muscle were incised bone tissue volume/total tissue volume (BV/TV), bone
layer by layer after anesthesia was administered. Using trabecular separation/spacing (Tb. SP), bone trabecular
an electric grinder, a bone tunnel with a diameter of 6 thickness (Tb. Th), and nucleus pulposus number (Tb. N).
mm was created beneath the weight-bearing area of the
femoral head to a depth of 6 mm. The scaffold was then 2.7.3. Histopathological evaluation
implanted in the area of the bone defects, and the incision After collecting and fixing femoral samples in 4%
was closed and disinfected layer by layer with iodine. Three paraformaldehyde, the samples were decalcified in 10%
days after surgery, 800,000 U of penicillin were injected EDTA and dehydrated in ethanol. They were subsequently
intramuscularly daily to prevent infection, and the healing embedded in paraffin. For the purposes of histological and
of the animal’s incision was monitored. immunohistochemical analysis, 6 µm thick sections were
obtained. According to the instructions, H&E staining, Masson’s
2.7. In vivo bone repair evaluation trichrome staining and BMP-2 immunohistochemical staining
were performed. The results were analyzed using a Nikon light
2.7.1. Sample collection microscope. Finally, we assessed the positively stained regions
Femoral heads were collected at predetermined post- for semi-quantitative analysis using ImageJ.
operative time points (4 and 8 weeks) to evaluate bone
repair, and major organs (heart, liver, spleen, lungs, and 2.8. In vivo biocompatibility analysis
kidneys) and venous blood were harvested at week 8 for The animals’ venous blood was used in routine blood
safety analysis. test as well as liver and kidney function test, while the
pathological changes in the main organs were analyzed
2.7.2. Radiology evaluation using H&E staining.
Bone regeneration in the bone defect area was assessed
using high-resolution micro-computed tomography 2.9. Data analysis
(micro-CT; Siemens, German). Scan parameters were All data are presented as mean ± SD. Unless otherwise
set to 80 kV, 500 μA, and 40.5 μm pixels. The quality of stated, data were analyzed between groups using analysis
Volume 10 Issue 1 (2024) 437 https://doi.org/10.36922/ijb.1152