
Page 440 - IJB-10-3
P. 440
International Journal of Bioprinting Different modeling of porous scaffolds
This discrepancy arises from the larger surface area of the permeability, this paper adopts the maximum projected
thickened scaffold compared to the filled scaffold, coupled diameter of the cross-sectional pore as the designated pore
with its more intricate surface structure. Consequently, diameter. When viewed from the top, P unit-filled scaffolds
the path of the laser scan is longer and errors accumulate, have the largest pore size, measuring 2.08 mm. After the
leading to greater differences in porosity. Despite surface is thickened, the pore size decreases, and the pore
36
introducing some errors, the large specific surface area of distribution becomes more dispersed. Apart from the P unit
the thickened surface structure is more advantageous for scaffold, the order of pore sizes in the various unit scaffolds
early osteoblast attachment than that of the filled structure. is IW-P > G > D. Biological materials require specific pore
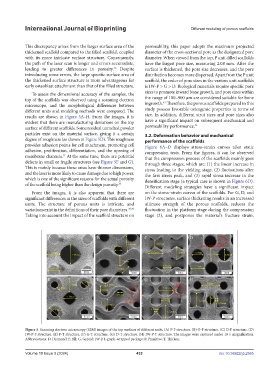
To assess the dimensional accuracy of the samples, the sizes to promote inward bone growth, and pore sizes within
top of the scaffolds was observed using a scanning electron the range of 100–900 μm are considered suitable for bone
41
microscope, and the morphological differences between ingrowth. Therefore, the porous scaffolds prepared in this
different units and modeling methods were compared. The study possess favorable osteogenic properties in terms of
results are shown in Figure 5A–H. From the images, it is size. In addition, different strut sizes and pore sizes also
evident that there are manufacturing deviations on the top have a significant impact on subsequent mechanical and
surface of different scaffolds. Some residual unmelted powder permeability performance. 42
particles exist on the material surface, giving it a certain 3.2. Deformation behavior and mechanical
degree of roughness (as shown in Figure 5D). This roughness performance of the scaffolds
provides adhesion points for cell attachment, promoting cell Figure 6A–D displays stress–strain curves after static
adhesion, proliferation, differentiation, and the opening of compression tests. From the figures, it can be observed
membrane channels. At the same time, there are potential that the compression process of the scaffolds mainly goes
37
defects in small or fragile structures (see Figure 5F and G). through three stages, which are: (1) the linear increase in
This is mainly because these areas have thinner dimensions, stress leading to the yielding stage, (2) fluctuations after
and the laser is more likely to cause damage due to high power, the first stress peak, and (3) rapid stress increase in the
which is one of the significant reasons for the actual porosity densification stage (a typical case is shown in Figure 6D).
of the scaffold being higher than the design porosity. 38 Different modeling strategies have a significant impact
From the images, it is also apparent that there are on the stress–strain curves of the scaffolds. For G, D, and
significant differences in the sizes of scaffolds with different IW-P structures, surface thickening results in an increased
units. The structure of porous units is intricate, and ultimate strength of the porous scaffolds, reduces the
variations exist in the definitions of their pore diameters. 39,40 fluctuation in the platform stage during the compression
Taking into account the impact of the scaffold structure on stage (2), and postpones the material’s fracture strain.
Figure 5. Scanning electron microscopy (SEM) images of the top surfaces of different units. (A) P-F structure. (B) G-F structure. (C) D-F structure. (D)
IW-P-F structure. (E) P-T structure. (F) G-T structure. (G) D-T structure. (H) IW-P-T structure. The images were captured under 10 × magnification.
Abbreviations: D, Diamond; F, Fill; G, Gyroid; IW-P, I-graph-wrapped package; P, Primitive; T, Thicken.
Volume 10 Issue 3 (2024) 432 doi: 10.36922/ijb.2565