
Page 439 - IJB-10-3
P. 439
International Journal of Bioprinting Different modeling of porous scaffolds
Table 2. Parameters in the formula for calculating permeability Table 3. Parameters of the scaffolds
Symbol Parameter Value Design Design surface Actual
porosity (%) area (mm ) porosity (%)
2
−3
Μ Dynamic viscosity coefficient of water 10 Pa∙s
H Height of samples 18 mm P-F 60 1831 61.95
A The cross-sectional area of the water 490.625 mm 2 P-T 60 3293 63.39
column G-F 60 2416 60.09
A The cross-sectional area of the scaffold 113.04 mm 2 G-T 60 4220 60.95
3
Ρ Density of water 10 kg/m 3 D-F 60 2860 61.84
G Gravity acceleration 9.8 m/s 2 D-T 60 5287 62.29
IW-P-F 60 2617 62.01
images, it can be observed that the porous structures IW-P-T 60 4933 62.62
between different scaffolds are well-constructed, and Abbreviations: D, Diamond; F, Fill; G, Gyroid; IW-P, I-graph-wrapped
there are no apparent blockages in the porous scaffolds. package; P, Primitive; T, Thicken.
Interconnected porous networks have been shown to
promote inward bone growth. Table 3 shows the design the data reveals a discernible pattern in the impact of
35
parameters and measured porosities among different structural units and modeling strategies on scaffold
porous scaffolds. It is evident that there is a difference porosity. It is evident that the porosity of the scaffolds
between the designed porosity and the porosity measured consistently increased, indicating material reduction
using the drainage method, with the printed scaffold’s during processing. This reduction is primarily attributed to
porosity being higher than the design value. However, the step effect inherent in the printing process, particularly
the overall error in the scaffolds is approximately 2%, when there are substantial changes in the surface angles,
indicating a certain degree of repeatability in the additive resulting in material reduction at the scaffold edges.
manufacturing of porous scaffolds.
Notably, the porosity of the thickened minimum surface
Table 3 presents the design parameters and actual scaffold is significantly higher than that of the equivalent
porosity of the scaffold. A more in-depth analysis of surface-filled scaffold across different modeling strategies.
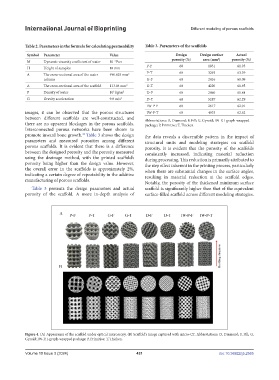
Figure 4. (A) Appearance of the scaffold under optical microscopy. (B) Scaffold’s image captured with micro-CT. Abbreviations: D, Diamond; F, Fill; G,
Gyroid; IW-P, I-graph-wrapped package; P, Primitive; T, Thicken.
Volume 10 Issue 3 (2024) 431 doi: 10.36922/ijb.2565