
Page 532 - IJB-10-3
P. 532
International Journal of Bioprinting Mechanical responses of 3D-printed AFO
chosen to provide more controllable testing conditions. behaviors under PF and DF loading. A linear moment–
The displacement control method was utilized in the test ankle angle relationship was found for all AFOs under
with a loading rate of 1 mm/min to eliminate dynamic PF loading. In comparison, the moment first increased
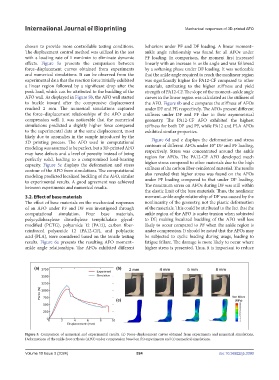
effects. Figure 5a presents the comparison between linearly with an increase in ankle angle and was followed
force–displacement curves obtained from experiments by a softening phase under DF loading. It was noticeable
and numerical simulations. It can be observed from the that the ankle angle required to reach the nonlinear region
experimental data that the reaction force initially exhibited was significantly higher for PA12-CF compared to other
a linear region followed by a significant drop after the materials, attributing to the higher stiffness and yield
peak load, which can be attributed to the buckling of the strength of PA12-CF. The slope of the moment–ankle angle
AFO wall. As displayed in Figure 5b, the AFO wall started curves in the linear region was calculated as the stiffness of
to buckle inward after the compressive displacement the AFO. Figure 6b and c compares the stiffness of AFOs
reached 2 mm. The numerical simulations captured under DF and PF, respectively. The AFOs present different
the force–displacement relationships of the AFO under stiffness under DF and PF due to their asymmetrical
compression well. It was noticeable that the numerical geometry. The PA12-CF AFO exhibited the highest
simulations predicted a slightly higher force compared stiffness for both DF and PF, while PA12 and PLA AFOs
to the experimental data at the same displacement, most exhibited similar properties.
likely due to anomalies in the sample introduced by the Figure 6d and e displays the deformation and stress
3D printing process. The AFO used in computational contours of different AFOs under 10° DF and PF loading,
modeling was assumed to be perfect, but a 3D-printed AFO respectively. Stress was concentrated around the ankle
may have defects and a level of porosity instead of being
perfectly solid, leading to a compromised load-bearing region for AFOs. The PA12-CF AFO developed much
capacity. Figure 5c displays the deformation and stress higher stress compared to other materials due to the high
contour of the AFO from simulations. The computational stiffness of the carbon fiber-reinforced material. The results
modeling predicted localized buckling of the AFO, similar also revealed that higher stress was found on the AFOs
to experimental results. A good agreement was achieved under PF loading compared to that under DF loading.
between experiments and numerical results. The maximum stress on AFOs during DF was still within
the elastic limit of the base materials. Thus, the nonlinear
3.2. Effect of base materials moment–ankle angle relationship of DF was caused by the
The effect of base materials on the mechanical responses nonlinearity of the geometry, not the plastic deformation
of an AFO under PF and DF was investigated through of the materials. This could be attributed to the fact that the
computational simulation. Four base materials, ankle region of the AFO is under tension when subjected
polycyclohexylene dimethylene terephthalate glycol- to DF, making localized buckling of the AFO wall less
modified (PCTG), polyamide 12 (PA12), carbon fiber- likely to occur compared to PF when the ankle region is
reinforced polyamide 12 (PA12-CF), and polylactic under compression. It should be noted that the AFOs may
acid (PLA), were considered based on the tensile testing be subjected to cyclic loading during usage, leading to
results. Figure 6a presents the resulting AFO moment– fatigue failure. The damage is more likely to occur where
ankle angle relationships. The AFOs exhibited different higher stress is presented. Thus, it is important to reduce
Figure 5. Comparison of numerical and experimental results. (a) Force–displacement curves obtained from experiments and numerical simulations.
Deformations of the ankle-foot orthosis (AFO) under compression based on (b) experiments and (c) numerical simulations.
Volume 10 Issue 3 (2024) 524 doi: 10.36922/ijb.3390