
Page 533 - IJB-10-3
P. 533
International Journal of Bioprinting Mechanical responses of 3D-printed AFO
the stress concentration on the AFO. As the PA12 AFO can that both DF and PF stiffness increased with increased
provide sufficient stiffness and PA12 has excellent ductility AFO thickness.
compared to other materials, it can be a favorable candidate Although all AFOs exhibited higher stiffness under PF
for 3D-printed AFOs. The remainder of the parametric than DF, the DF stiffness increased at a higher rate. This
study was based on the PA12 material.
can be attributed to the fact that stiffness is dominated
3.3. Effect of ankle-foot orthosis thickness by thickness, and the asymmetrical geometry has a more
3D printing can provide more flexibility in terms of AFO limited effect. With 3D-printed AFOs, a wide range of
thickness compared to the limited thickness options stiffness can be achieved by selecting the proper thickness
available for traditionally fabricated AFOs. The effect according to clinical requirements. Figure 7c and d
of AFO thickness on AFO mechanical responses was features the deformation and stress contour of AFOs with
evaluated. Figure 7a compares moment–ankle angle different thicknesses at 10° of DF and PF, respectively.
relationships for AFOs with thicknesses of 2–6 mm. The Stress concentration was found for AFOs with various
increase in AFO thickness resulted in a higher moment thicknesses at the ankle region. The AFO thickness had a
at the same DF or PF angles but had a limited effect on limited effect on the deformation and stress distributions
mechanical responses. A linear moment–ankle angle of the AFO.
relationship was found for all AFO thicknesses under PF,
while DF displayed nonlinearity. A larger ankle angle was 3.4. Effect of trimline location
required to reach nonlinear deformation with increased In practice, the trimline of AFOs is determined by
AFO stiffness. The slope of the moment–ankle angle observational evaluations and the professional experience
curves in the linear region was calculated as the stiffness of clinicians. This section provides a quantitative evaluation
of the AFO. Figure 7b presents the DF and PF stiffness of how trimline location affects the DF and PF stiffness of
by AFO thickness. A power function was used to fit the AFOs. Two major trim directions, namely the inferior and
AFO stiffness–thickness relationships. It can be seen posterior trim depths, were examined.
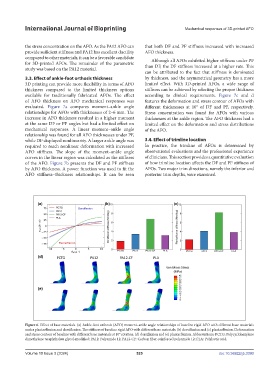
Figure 6. Effect of base materials. (a) Ankle-foot orthosis (AFO) moment–ankle angle relationships of baseline rigid AFO with different base materials
under plantarflexion and dorsiflexion. The stiffness of baseline rigid AFO with different base materials: (b) dorsiflexion and (c) plantarflexion. Deformation
and stress contour of baseline with different base materials at 10° rotation: (d) dorsiflexion and (e) plantarflexion. Abbreviations: PCTG: Polycyclohexylene
dimethylene terephthalate glycol-modified; PA12: Polyamide 12; PA12-CF: Carbon fiber-reinforced polyamide 12; PLA: Polylactic acid.
Volume 10 Issue 3 (2024) 525 doi: 10.36922/ijb.3390