
Page 70 - IJB-4-1
P. 70
Shuai C, et al.
(A) (B)
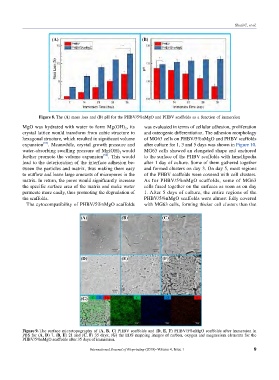
Figure 8. The (A) mass loss and (B) pH for the PHBV/5%nMgO and PHBV scaffolds as a function of immersion
MgO was hydrated with water to form Mg(OH) , its was evaluated in terms of cellular adhesion, proliferation
2
crystal lattice would transform from cubic structure to and osteogenic differentiation. The adhesion morphology
hexagonal structure, which resulted in significant volume of MG63 cells on PHBV/5%nMgO and PHBV scaffolds
expansion [57] . Meanwhile, crystal growth pressure and after culture for 1, 3 and 5 days was shown in Figure 10.
water-absorbing swelling pressure of Mg(OH) would MG63 cells showed an elongated shape and anchored
2
further promote the volume expansion [58] . This would to the surface of the PHBV scaffolds with lamellipodia
lead to the deterioration of the interface adhesion be- after 1 day of culture. Some of them gathered together
tween the particles and matrix, thus making them easy and formed clusters on day 3. On day 5, most regions
to outflow and leave large amounts of micropores in the of the PHBV scaffolds were covered with cell clusters.
matrix. In return, the pores would significantly increase As for PHBV/5%nMgO scaffolds, some of MG63
the specific surface area of the matrix and make water cells fused to geth er on the surfaces as soon as on day
permeate more easily, thus promoting the degradation of 1. After 5 days of culture, the entire regions of the
the scaffolds. PHBV/5%nMgO scaffolds were almost fully covered
The cytocompatibility of PHBV/5%nMgO scaffolds with MG63 cells, forming thicker cell clusters than that
(A) (B) (C)
(D) (E) (F)
(G)
Figure 9. The surface microtopography of (A, B, C) PHBV scaffolds and (D, E, F) PHBV/5%nMgO scaffolds after immersion in
PBS for (A, D) 7, (B, E) 21 and (C, F) 35 days; (G) the EDS mapping images of carbon, oxygen and magnesium elements for the
PHBV/5%nMgO scaffolds after 35 days of immersion.
International Journal of Bioprinting (2018)–Volume 4, Issue 1 9