
Page 15 - IJB-10-4
P. 15
International Journal of Bioprinting PAI for 3D bioprinted constructs
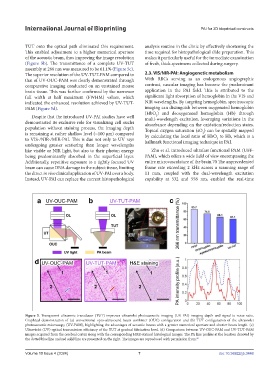
TUT onto the optical path eliminated this requirement. analysis routine in the clinic by effectively shortening the
This enabled adjustment to a higher numerical aperture time required for histopathological slide preparation. This
of the acoustic beam, thus improving the image resolution makes it particularly useful for the immediate examination
(Figure 5b). The transmittance of a complete UV-TUT of fresh, thick specimens collected during surgery.
assembly at 266 nm was measured to be 61.1% (Figure 5c).
The superior resolution of the UV-TUT-PAM compared to 2.3. VIS/NIR-PAI: Angiogenetic metabolism
that of UV-OUC-PAM was clearly demonstrated through With RBCs serving as an endogenous angiographic
comparative imaging conducted on an unstained mouse contrast, vascular imaging has become the predominant
brain tissue. This was further confirmed by the narrower application in the PAI field. This is attributed to the
full width at half maximum (FWHM) values, which significant light absorption of hemoglobin in the VIS and
indicated the enhanced resolution achieved by UV-TUT- NIR wavelengths. By targeting hemoglobin, spectroscopic
PAM (Figure 5d). imaging can distinguish between oxygenated hemoglobin
(HbO ) and deoxygenated hemoglobin (Hb) through
2
Despite that the introduced UV-PAI studies have well multi-wavelength excitation, leveraging variations in the
demonstrated its exclusive role for visualizing cell nuclei absorbance depending on the oxidation/reduction states.
population without staining process, the imaging depth Topical oxygen saturation (sO ) can be spatially mapped
is remaining at rather shallow level (~100 μm) compared by calculating the local ratio of HbO to Hb, which is a
2
to VIS-/NIR-/MIR-PAI. This is due not only to UV rays hallmark functional imaging technique in PAI.
2
undergoing greater scattering than longer wavelengths
like visible or NIR light, but also to their photon energy Zhu et al. introduced ultrafast functional PAM (UFF-
being predominantly absorbed in the superficial layer. PAM), which offers a wide field of view encompassing the
Additionally, repetitive exposure to a tightly focused UV entire microvasculature of the brain.70 The unprecedented
beam can cause DNA damage in the subject tissue, limiting frame rate exceeding 2 kHz across a scanning range of
the direct in vivo clinical application of UV-PAI over a body. 11 mm, coupled with the dual-wavelength excitation
Instead, UV-PAI can replace the current histopathological capability at 532 and 558 nm, enabled the real-time
Figure 5. Transparent ultrasonic transducer (TUT) improves ultraviolet-photoacoustic imaging (UV-PAI) imaging depth and signal-to-noise ratio.
Graphical demonstration of (a) conventional opto-ultrasound beam combiner (OUC) configuration and (b) TUT configuration of the ultraviolet
photoacoustic microscopy (UV-PAM), highlighting the advantages of acoustic beams with a greater numerical aperture and shorter beam length. (c)
Ultraviolet (UV) optical transmission efficiency of the TUT at gradual fabrication level. (d) Comparison between UV-OUC-PAM and UV-TUT-PAM
images acquired from the cerebral cortex along with the corresponding H&E-stained histological images. The PA line profiles at the location denoted by
the dotted blue line and red solid line are presented on the right. The images are reproduced with permission from. 69
Volume 10 Issue 4 (2024) 7 doi: 10.36922/ijb.3448