
Page 17 - IJB-10-4
P. 17
International Journal of Bioprinting PAI for 3D bioprinted constructs
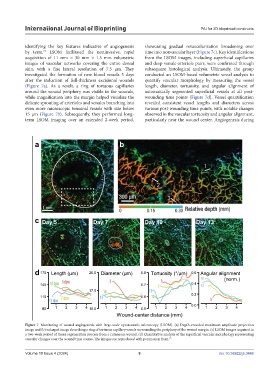
identifying the key features indicative of angiogenesis showcasing gradual revascularization broadening over
by term. LSOM facilitated the noninvasive, rapid time into nonvascular layer (Figure 7c). Key identifications
75
acquisition of 11 mm × 30 mm × 1.5 mm volumetric from the LSOM images, including superficial capillaries
images of vascular networks covering the entire dorsal and deep venule-arteriole pairs, were confirmed through
skin, with a fine lateral resolution of 7.5 μm. They subsequent histological analysis. Ultimately, the group
investigated the formation of new blood vessels 5 days conducted an LSOM-based volumetric vessel analysis to
after the induction of full-thickness excisional wounds quantify vascular morphology by measuring the vessel
(Figure 7a). As a result, a ring of tortuous capillaries length, diameter, tortuosity, and angular alignment of
around the wound periphery was visible in the wounds, automatically segmented superficial vessels at all post-
while magnification into the margin helped visualize the wounding time points (Figure 7d). Vessel quantification
delicate sprouting of arterioles and venules branching into revealed consistent vessel lengths and diameters across
even more microscopic terminal vessels with size below various post-wounding time points, with notable changes
15 μm (Figure 7b). Subsequently, they performed long- observed in the vascular tortuosity and angular alignment,
term LSOM imaging over an extended 2-week period, particularly near the wound center. Angiogenesis during
Figure 7. Monitoring of wound angiogenesis with large-scale optoacoustic microscopy (LSOM). (a) Depth-encoded maximum amplitude projection
image and (b) enlarged image describing a ring of tortuous capillary vessels surrounding the periphery of the wound margin. (c) LSOM images acquired in
a two-week period of tissue regeneration process from a cutaneous wound. (d) Quantitative analysis of the superficial vascular morphology representing
vascular changes over the wound time course. The images are reproduced with permission from. 75
Volume 10 Issue 4 (2024) 9 doi: 10.36922/ijb.3448