
Page 201 - IJB-10-4
P. 201
International Journal of Bioprinting Horsetail-inspired lattice for bone use
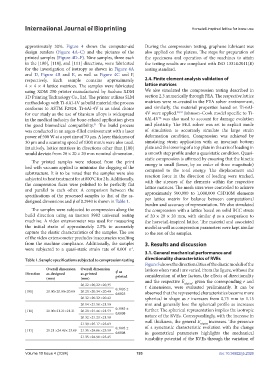
approximately 30%. Figure 4 shows the computer-aid During the compression testing, graphene lubricant was
design renders (Figure 4A–C) and the pictures of the also applied on the platens. The steps for preparation of
printed samples (Figure 4D–F). Nine samples, three each the specimens and operation of the machines to attain
in the [100], [110], and [111] directions, were fabricated the testing results are compliant with ISO 13314:2011(E)
for the investigation of isotropy as shown in Figure 4A testing standard.
and D, Figure 4B and E, as well as Figure 4C and F,
respectively. Each sample contains approximately 2.4. Finite element analysis validation of
4 × 4 × 4 lattice matrices. The samples were fabricated lattice matrices
using XDM 250 printer manufactured by Suzhou XDM We also simulated the compression testing described in
3D Printing Technology Co., Ltd. The printer utilizes SLM section 2.3 numerically through FEA. The respective lattice
methodology with Ti-6Al-4V as build material; the process matrices were re-created in the FEA solver environment,
conforms to ASTM F2924. Ti-6Al-4V is an ideal choice and similarly, the material properties based on Ti-6Al-
for our study as the use of titanium alloys is widespread 4V were applied. 32,33 Johnson–Cook model specific to Ti-
34
in the medical industry for bone-related application given 6Al-4V was also used to account for damage evolution
the good biomedical compatibility. The build process and plasticity. The FEA solver was set to explicit mode
31
was conducted in an argon-filled environment with a laser of simulation to accurately simulate the large strain
power of 500 W at a spot size of 70 μm. A layer thickness of deformation condition. Compression was achieved by
30 μm and a scanning speed of 1300 mm/s were also used. simulating strain application with an invariant bottom
Intuitively, lattice matrices in directions other than [100] plate and the lowering of a top plate in the axis of loading in
would deviate from 20 × 20 × 20 mm nominal dimension. a smooth step profile under a quasistatic condition. Quasi-
static compression is affirmed by ensuring that the kinetic
The printed samples were released from the print
bed with vacuum applied to minimize the clogging of the energy is small (lower, by an order of three magnitude)
compared to the total energy. The displacement and
substructure. It is to be noted that the samples were also reaction force in the direction of loading were tracked,
subjected to heat treatment for at 800°C for 2 h. Additionally, with the stresses of the elements within the respective
the compression faces were polished to be perfectly flat
and parallel to each other. A comparison between the lattice matrices. The mesh sizes were controlled to achieve
specifications of the processed samples to that of the as- approximately 500,000 to 1,000,000 C3D10M elements
designed dimensions and φ of 0.2940 is shown in Table 1. per lattice matrix for balance between computational
burden and accuracy of representation. We also simulated
The samples were subjected to compression along the the compression with a lattice based on solid BCC struts
build direction using an Instron 5982 universal testing of 20 × 20 × 20 mm, with similar ϕ as a comparison to
machine. A video extensometer was used for measuring the horsetail-inspired lattice. The material and associated
the initial strain of approximately 2.5% to accurately model as well as compression parameters were kept similar
capture the elastic characteristics of the samples. The use to the rest of the samples.
of the video extensometer precludes inaccuracies resulting
from the machine compliance. Additionally, the samples 3. Results and discussion
were subjected to a quasi-static strain rate of 0.001 s .
-1
3.1. General mechanical performance and
Table 1. Sample specifications subjected to compression testing directionality characteristics of RVEs
Figure 5 shows the directionalities of the elastic moduli of the
Overall dimension Overall dimension lattices when r and t are varied. From the figure, without the
Direction as-designed as-printed ϕ as consideration of other factors, the effects of directionality
(mm) (mm) printed and the respective E , given the corresponding r and
20.22 ×20.22 ×20.35 relative
0.3026 ± t dimensions, were evaluated preliminarily. It can be
[100] 20.00×20.00×20.00 20.20 ×20.34 ×20.40
0.0023 observed that the represented characteristics become more
20.32 ×20.32 ×20.42 spherical in shape as r increases from 0.75 mm to 1.15
20.14 ×21.50 ×21.50 mm and generally lose the spherical profile as increases
[110] 20.00×21.21×21.21 20.20 ×21.46 ×21.53 0.3083 ± further. The spherical representation implies the isotropic
0.0008
20.32 ×21.23 ×21.58 nature of the RVEs. Correspondingly, with the increase in
21.39 ×25.17 ×23.63 wall thickness, the general E relative increases. The presence
0.3093 ± of a systematic characteristic evolution with the change
[111] 21.21 ×24.49× 23.09 21.35 ×24.86 ×23.59
0.0008 in geometrical parameters highlights the mechanical
21.35 ×24.90 ×23.45 tunability potential of the RVEs through the variation of
Volume 10 Issue 4 (2024) 193 doi: 10.36922/ijb.2326