
Page 204 - IJB-10-4
P. 204
International Journal of Bioprinting Horsetail-inspired lattice for bone use
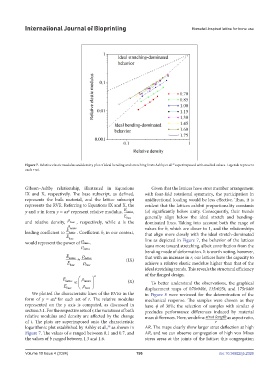
Figure 7. Relative elastic modulus and density plot of ideal bending and stretching from Ashby et al. superimposed with studied values. Legends represent
38
each r set.
Gibson–Ashby relationship, illustrated in Equations Given that the lattices have strut member arrangement
IX and X, respectively. The base subscript, as defined, with four-fold rotational symmetry, the participation in
represents the bulk material, and the lattice subscript unidirectional loading would be less effective. Thus, it is
represents the RVE. Referring to Equations IX and X, the evident that the lattices exhibit proportionality constants
y and x in form y = ax represent relative modulus, E lattice, (a) significantly below unity. Consequently, their trends
b
E base generally align below the ideal stretch and bending-
and relative density, ρ base , respectively, while a is the dominated lines. Taking into account both the range of
ρ lattice values for b, which are closer to 1, and the relationships
leading coefficient to E lattice . Coefficient b, in our context, that align more closely with the ideal stretch-dominated
E base
ρ
would represent the power of base . line as depicted in Figure 7, the behavior of the lattices
ρ lattice leans more toward stretching, albeit contribution from the
bending mode of deformation. It is worth noting, however,
E ρ that with an increase in r, our lattices have the capacity to
lattice ≈ lattice (IX)
E base ρ base achieve a relative elastic modulus higher than that of the
ideal stretching trends. This reveals the structural efficiency
of the flanged design.
2
E ρ
lattice ∝ lattice (X) To better understand the observations, the graphical
E base ρ base displacement maps of 070r040t, 115r025t, and 175r040t
We plotted the characteristic lines of the RVEs in the in Figure 8 were reviewed for the determination of the
form of y = ax for each set of r. The relative modulus mechanical response. The samples were chosen as they
b
represented on the y axis is computed, as discussed in have φ of 30%; the selection of samples with similar φ
section 3.1. For the respective sets of r, the variations of both precludes performance differences induced by material
relative modulus and density are affected by the change mass differences. Here, we define strut length as aspect ratio,
of t. The plots are superimposed onto the characteristic r
logarithmic plot established by Ashby et al., as shown in AR. The maps clearly show larger strut deflection at high
38
Figure 7. The values of a ranged between 0.1 and 0.7, and AR, and we can observe congregation of high von Mises
the values of b ranged between 1.3 and 1.6. stress areas at the joints of the lattice; this congregation
Volume 10 Issue 4 (2024) 196 doi: 10.36922/ijb.2326