
Page 207 - IJB-10-4
P. 207
International Journal of Bioprinting Horsetail-inspired lattice for bone use
within 20%. The observations support FEA simulations We also observed that E matrix , yield strength, and
as an accurate means of performance determination both energy absorption capability are significantly lower for
at individual and lattice matrices levels. Additionally, the the BCC lattice matrix. The lower E matrix is consistent
good agreement of E matrix between samples of different with the findings described in section 3.2 as compared
directions also confirmed the expected high degree of with that of horsetail-inspired lattice matrices. The lower
isotropic characteristics. The range of E matrix determined by E matrix of the BCC lattice matrix would be lower than the
our study, 9–11 GPa, is within the range of elastic moduli horsetail-inspired lattice matrices due to the inherent
of typical human trabecular and cortical bones. 35,36 bending dominance characteristics of the BCC lattice.
The horsetail-inspired modifications applied in our study
The yield strength exhibited by the stress–strain to the lattice matrices resulted in higher E matrix due to
characteristics of the physical compression testing and FEA induced stretching characteristics.
compression testing described in section 2.4 are also in Figure 11 also shows the mean curves as well
general agreement, in the region of 100–140 MPa. The range as standard deviations for the respective sets of the
of this compressive yield strength is within that of the human compression testing. We observed that the mean curves
cortical bone. It is also worth noting that the compressive from the physical compression testing trended lower
40
strength obtained from compression testing is approximately compared with that of the FEA, albeit within proximity of
2% or greater; this finding supports the use of the horsetail- each other. Additionally, the deviations are greater starting
inspired lattice matrices in bone-related application, where a from the non-elastic regions, while all the elastic regions
strain level of 2–10% is optimal for primary healing. exhibited relatively small deviations. Within the elastic
41
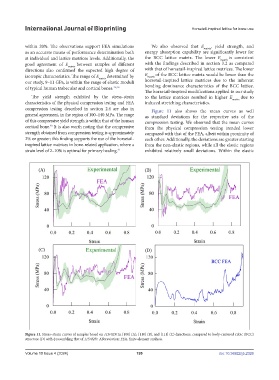
Figure 11. Stress–strain curves of samples based on 115r025t in [100] (A), [110] (B), and [111] (C) directions, compared to body-centered cubic (BCC)
structure (D) with φ resembling that of 115r025t. Abbreviation: FEA, finite element analysis.
Volume 10 Issue 4 (2024) 199 doi: 10.36922/ijb.2326