
Page 15 - IJB-8-2
P. 15
Hu, et al.
F-actin and nuclei of the MT3T3-E1 cells were represented than that on M scaffolds. However, no significant difference
with green, red, and blue fluorescence, respectively. The was observed between the mean fluorescence intensity on
confluence of vinculin and F-actin confirmed the cytoplasm MS and MSN scaffolds. The improved cellular adhesion
localization of vinculin, which were partially adhered behaviors on the sub-microscale fibrous architectures can
on the microfibers (Figure 3D) and completely wrap the be attributed to the morphology of the ultrafine fibers, which
sub-microscale fibers (Figure 3E and F). This finding provide unique contact cues for cell membrane to warp .
[31]
demonstrated that the cell exhibited a firm interaction with
sub-microscale fibers. Semi-quantification of vinculin 3.3. Cell spreading morphology on scaffolds with
expression through measuring fluorescence intensity was micro/sub-microfibers
further shown in Figure 3H. The fluorescence intensity
of vinculin on MS and MSN scaffolds was 21.22 ± 0.90 We further analyzed the cell morphology on porous
and 22.47 ± 1.77, which were 1.17- and 1.24-fold higher scaffolds with different fiber sizes and organizations.
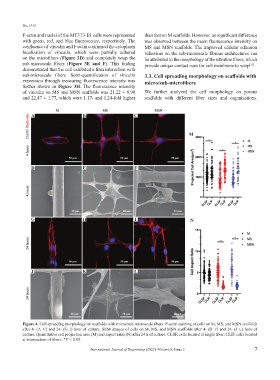
A B C
M
D E F
G H I N
J K L
Figure 4. Cell spreading morphology on scaffolds with micro/sub-microscale fibers. F-actin staining of cells on M, MS, and MSN scaffolds
after 4- (A–C) and 24- (G–I) hour of culture. SEM images of cells on M, MS, and MSN scaffolds after 4- (D–F) and 24- (J–L) hour of
culture. Quantitative cell projection area (M) and aspect ratio (N) after 24 h of culture. CLSF, cells located at single fiber; CLIF, cells located
at intersection of fibers. *P < 0.05.
International Journal of Bioprinting (2022)–Volume 8, Issue 2 7