
Page 16 - IJB-8-2
P. 16
Electrohydrodynamic Printed Sub-microscale Fibrous Architectures Improved Cell Attachment and Collagen Type I Deposition
Figure 4 shows fluorescent and SEM images of the 3.4. MC3T3-E1 cells growth and migration on
cytoskeleton of the seeded MC3T3-E1 cells. After 4 h scaffolds with micro/sub-microfibers
of culture, cells remained a round shape morphology
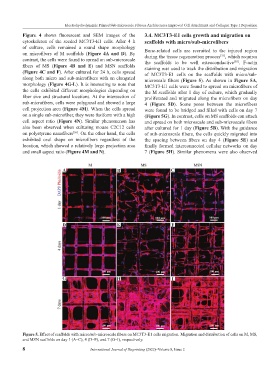
on microfibers of M scaffolds (Figure 4A and D). By Bone-related cells are recruited to the injured region
[37]
contrast, the cells were found to spread on sub-microscale during the tissue regeneration process , which requires
the scaffolds to be well osteoconductive . F-actin
[38]
fibers of MS (Figure 4B and E) and MSN scaffolds staining was used to track the distribution and migration
(Figure 4C and F). After cultured for 24 h, cells spread of MC3T3-E1 cells on the scaffolds with micro/sub-
along both micro and sub-microfibers with an elongated microscale fibers (Figure 5). As shown in Figure 5A,
morphology (Figure 4G-L). It is interesting to note that MC3T3-E1 cells were found to spread on microfibers of
the cells exhibited different morphologies depending on the M scaffolds after 1 day of culture, which gradually
fiber size and structural locations. At the intersection of proliferated and migrated along the microfibers on day
sub-microfibers, cells were polygonal and showed a large 4 (Figure 5D). Some pores between the microfibers
cell projection area (Figure 4M). When the cells spread were found to be bridged and filled with cells on day 7
on a single sub-microfiber, they were fusiform with a high (Figure 5G). In contrast, cells on MS scaffolds can attach
cell aspect ratio (Figure 4N). Similar phenomenon has and spread on both microscale and sub-microscale fibers
also been observed when culturing mouse C2C12 cells after cultured for 1 day (Figure 5B). With the guidance
on polystyrene nanofibers . On the other hand, the cells of sub-microscale fibers, the cells quickly migrated into
[36]
exhibited oval shape on microfibers regardless of the the spacing between fibers on day 4 (Figure 5E) and
location, which showed a relatively large projection area finally formed interconnected cellular networks on day
and small aspect ratio (Figure 4M and N). 7 (Figure 5H). Similar phenomena were also observed
A B C
D E F
G H I
Figure 5. Effect of scaffolds with micro/sub-microscale fibers on MC3T3-E1 cells migration. Migration and distribution of cells on M, MS,
and MSN scaffolds on day 1 (A–C), 4 (D–F), and 7 (G–I), respectively.
8 International Journal of Bioprinting (2022)–Volume 8, Issue 2