
Page 248 - IJB-9-3
P. 248
International Journal of Bioprinting Multi-material bioprinting with OCT imaging
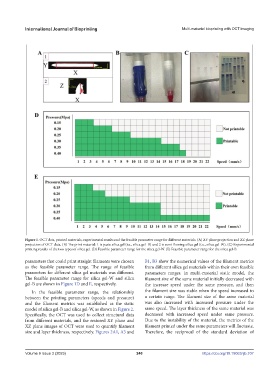
Figure 1. OCT data, printed materials, experimental results and the feasible parameter range for different materials. (A) XY plane projection and XZ plane
projection of OCT data. (B) The print material: 1 is paste silica gel (i.e., silica gel- B) and 2 is semi-flowing silica gel (i.e., silica gel-W). (C) Experimental
printing results of the two types of silica gel. (D) Feasible parameter range for the silica gel-W. (E) Feasible parameter range for the silica gel-B.
parameters that could print straight filaments were chosen B1, B3 show the numerical values of the filament metrics
as the feasible parameter range. The range of feasible from different silica gel materials within their own feasible
parameters for different silica gel materials was different. parameters ranges. In multi-material static model, the
The feasible parameter range for silica gel-W and silica filament size of the same material initially decreased with
gel-B are shown in Figure 1D and E, respectively. the increase speed under the same pressure, and then
In the feasible parameter range, the relationship the filament size was stable when the speed increased to
between the printing parameters (speeds and pressure) a certain range. The filament size of the same material
and the filament metrics was established as the static was also increased with increased pressure under the
model of silica gel-B and silica gel-W, as shown in Figure 2. same speed. The layer thickness of the same material was
Specifically, the OCT was used to collect structural data decreased with increased speed under same pressure.
from different materials, and the restored XY plane and Due to the instability of the material, the metrics of the
XZ plane images of OCT were used to quantify filament filament printed under the same parameters will fluctuate.
size and layer thickness, respectively. Figures 2A1, A3 and Therefore, the reciprocal of the standard deviation of
Volume 9 Issue 3 (2023) 240 https://doi.org/10.18063/ijb.707