
Page 253 - IJB-9-3
P. 253
International Journal of Bioprinting Multi-material bioprinting with OCT imaging
Figure 5. The flowchart of the printing process with the proposed method.
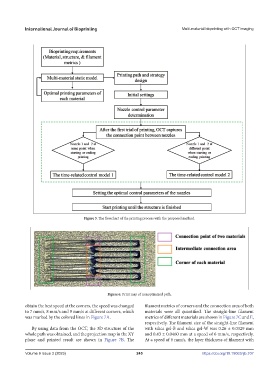
Figure 6. Print map of nonoptimized path.
obtain the best speed at the corners, the speed was changed filament metrics of corners and the connection area of both
to 7 mm/s, 8 mm/s and 9 mm/s at different corners, which materials were all quantified. The straight-line filament
was marked by the colored lines in Figure 7A. metrics of different materials are shown in Figure 7C and E,
respectively. The filament size of the straight-line filament
By using data from the OCT, the 3D structure of the with silica gel-B and silica gel-W was 0.26 ± 0.0329 mm
whole path was obtained, and the projection map in the XY and 0.43 ± 0.0460 mm at a speed of 6 mm/s, respectively.
plane and printed result are shown in Figure 7B. The At a speed of 6 mm/s, the layer thickness of filament with
Volume 9 Issue 3 (2023) 245 https://doi.org/10.18063/ijb.707