
Page 255 - IJB-9-3
P. 255
International Journal of Bioprinting Multi-material bioprinting with OCT imaging
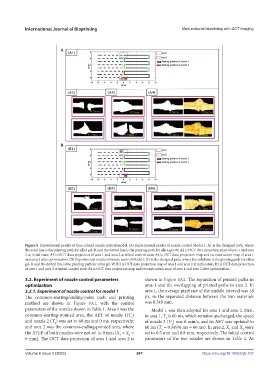
Figure 8. Experimental results of time-related nozzle control model. (A) Experimental results of nozzle control Model 1. A1 is the designed path, where
the solid line is the printing path for silica gel-B, and the dotted line is the printing path for silica gel-W; A2 is OCT data projection map of area 1 and area
2 at initial state; A3 is OCT data projection of area 1 and area 2 at initial control state; A4 is OCT data projection map and reconstruction map of area 1
and area 2 after optimization. (B) Experimental results of nozzle control Model 2. B1 is the designed path, where the solid line is the printing path for silica
gel-B, and the dotted line is the printing path for silica gel-W; B 2 is OCT data projection map of area 1 and area 2 at initial state; B3 is OCT data projection
of area 1 and area 2 at initial control state; B4 is OCT data projection map and reconstruction map of area 1 and area 2 after optimization.
3.2. Experiment of nozzle control parameters shown in Figure 8A2. The separation of printed paths in
optimization area 1 and the overlapping of printed paths in area 2. In
3.2.1. Experiment of nozzle control for model 1 area 1, the average pixel size of the middle interval was 18
The common-starting/ending-point path and printing px, so the separated distance between the two materials
method are shown in Figure 8A1, with the control was 0.349 mm.
parameters of the nozzles shown in Table 1. Area 1 was the Model 1 was then adopted for area 1 and area 2. First,
common-starting-pointed area, the AET of nozzle 1(T ) in area 1, T is 60 ms, which remains unchanged, the speed
1
1
and nozzle 2 (T ) was set to 60 ms and 0 ms, respectively; of nozzle 2 (V ) was 6 mm/s, and its AET was updated to
2
2
and area 2 was the common-ending-pointed area, where 60 ms (T = 0.349/6 ms ≈ 60 ms). In area 2, X and X were
2
2
1
the ATEP of both nozzles were not set to 0 mm (X = X = set to 0.5 mm and 0.8 mm, respectively. The initial control
1
2
0 mm). The OCT data projection of area 1 and area 2 is parameters of the two nozzles are shown in Table 2. As
Volume 9 Issue 3 (2023) 247 https://doi.org/10.18063/ijb.707