
Page 258 - IJB-9-3
P. 258
International Journal of Bioprinting Multi-material bioprinting with OCT imaging
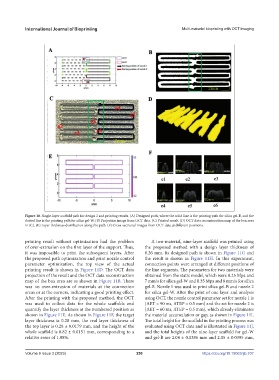
Figure 10. Single-layer scaffold path for design 2 and printing results. (A) Designed path, where the solid line is the printing path for silica gel-B, and the
dotted line is the printing path for silica gel-W. (B) Projection image from OCT data. (C) Printed result. (D) OCT data reconstruction map of the box area
in (C). (E) Layer thickness distribution along the path. (F) Cross-sectional images from OCT data at different positions.
printing result without optimization had the problem A two-material, nine-layer scaffold was printed using
of over-extrusion on the first layer of the support. Thus, the proposed method with a design layer thickness of
it was impossible to print the subsequent layers. After 0.26 mm. Its designed path is shown in Figure 11G and
the proposed path optimization and print nozzle control the result is shown in Figure 11H. In this experiment,
parameter optimization, the top view of the actual connection points were arranged at different positions of
printing result is shown in Figure 11D. The OCT data the line segments. The parameters for two materials were
projection of the result and the OCT data reconstruction obtained from the static model, which were 0.25 Mpa and
map of the box area are as shown in Figure 11B. There 7 mm/s for silica gel-W and 0.35 Mpa and 8 mm/s for silica
was no over-extrusion of materials at the connection gel-B. Nozzle 1 was used to print silica gel-B and nozzle 2
areas or at the corners, indicating a good printing effect. for silica gel-W. After the print of one layer and analysis
After the printing with the proposed method, the OCT using OCT, the nozzle control parameter set for nozzle 1 is
was used to collect data for the whole scaffolds and {AET = 90 ms, ATEP = 0.5 mm} and the set for nozzle 2 is
quantify the layer thickness at the numbered position as {AET = 60 ms, ATEP = 0.5 mm}, which already eliminates
shown in Figure 11E. As shown in Figure 11F, the target the material accumulation or gap, as shown in Figure 11I.
layer thickness is 0.28 mm, the real layer thickness of The total height for the scaffold in the printing process was
the top layer is 0.28 ± 0.0179 mm, and the height of the evaluated using OCT data and is illustrated in Figure 11J,
whole scaffold is 0.82 ± 0.0151 mm, corresponding to a and the total heights of the nine-layer scaffold for gel-W
relative error of 1.08%. and gel-B are 2.04 ± 0.0386 mm and 2.05 ± 0.0395 mm,
Volume 9 Issue 3 (2023) 250 https://doi.org/10.18063/ijb.707