
Page 257 - IJB-9-3
P. 257
International Journal of Bioprinting Multi-material bioprinting with OCT imaging
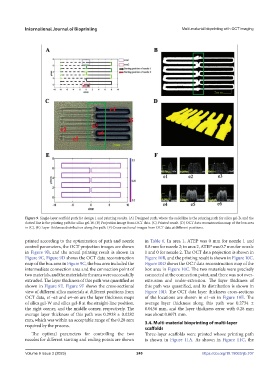
Figure 9. Single-layer scaffold path for design 1 and printing results. (A) Designed path, where the solid line is the printing path for silica gel-B, and the
dotted line is the printing path for silica gel-W. (B) Projection image from OCT data. (C) Printed result. (D) OCT data reconstruction map of the box area
in (C). (E) Layer thickness distribution along the path. (F) Cross-sectional images from OCT data at different positions.
printed according to the optimization of path and nozzle in Table 6. In area 1, ATEP was 0 mm for nozzle 1 and
control parameters, the OCT projection images are shown 0.8 mm for nozzle 2; in area 2, ATEP was 0.7 mm for nozzle
in Figure 9B, and the actual printing result is shown in 1 and 0 for nozzle 2. The OCT data projection is shown in
Figure 9C. Figure 9D shows the OCT data reconstruction Figure 10B, and the printing result is shown in Figure 10C.
map of the box area in Figure 9C, the box area included the Figure 10D shows the OCT data reconstruction map of the
intermediate connection area and the connection point of box area in Figure 10C. The two materials were precisely
two materials, and the materials in the area were successfully connected at the connection point, and there was not over-
extruded. The layer thickness of this path was quantified as extrusion and under-extrusion. The layer thickness of
shown in Figure 9E. Figure 9F shows the cross-sectional this path was quantified, and its distribution is shown in
view of different silica materials at different positions from Figure 10D. The OCT data layer thickness cross-sections
OCT data, e1–e3 and e4–e6 are the layer thickness maps of the locations are shown in e1–e6 in Figure 10E. The
of silica gel-W and silica gel-B at the straight-line position, average layer thickness along this path was 0.2734 ±
the right corner, and the middle corner, respectively. The 0.0456 mm, and the layer thickness error with 0.28 mm
average layer thickness of this path was 0.2938 ± 0.0282 was about 0.0071 mm.
mm, which was within an acceptable range of the 0.28 mm 3.4. Multi-material bioprinting of multi-layer
required by the process.
scaffolds
The optimal parameters for controlling the two Three-layer scaffolds were printed whose printing path
nozzles for different starting and ending points are shown is shown in Figure 11A. As shown in Figure 11C, the
Volume 9 Issue 3 (2023) 249 https://doi.org/10.18063/ijb.707