
Page 254 - IJB-9-3
P. 254
International Journal of Bioprinting Multi-material bioprinting with OCT imaging
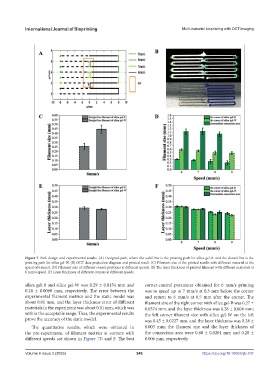
Figure 7. Path design and experimental results. (A) Designed path, where the solid line is the printing path for silica gel-B, and the dotted line is the
printing path for silica gel-W. (B) OCT data projection diagram and printed result. (C) Filament size of the printed results with different material at the
speed of 6 mm/s. (D) Filament size of different corner positions at different speeds. (E) The layer thickness of printed filament with different materials at
6 mm/s speed. (F) Layer thickness of different corners at different speeds.
silica gel-B and silica gel-W was 0.29 ± 0.0154 mm and corner-control parameter obtained for 6 mm/s printing
0.28 ± 0.0080 mm, respectively. The error between the was to speed up to 7 mm/s at 0.5 mm before the corner
experimental filament metrics and the static model was and return to 6 mm/s at 0.5 mm after the corner. The
about 0.01 mm, and the layer thickness error of different filament size of the right corner with silica gel-B was 0.27 ±
materials in the experiment was about 0.01 mm, which was 0.0374 mm, and the layer thickness was 0.28 ± 0.004 mm;
within the acceptable range. Thus, the experimental results the left corner filament size with silica gel-W on the left
prove the accuracy of the static model. was 0.45 ± 0.0227 mm, and the layer thickness was 0.28 ±
The quantitative results, which were obtained in 0.003 mm; the filament size and the layer thickness of
the pre-experiment, of filament metrics at corners with the connection area were 0.80 ± 0.0201 mm and 0.28 ±
different speeds are shown in Figure 7D and F. The best 0.006 mm, respectively.
Volume 9 Issue 3 (2023) 246 https://doi.org/10.18063/ijb.707